

The steady stream of scientific articles with irreproducible results, shaky conclusions, and poor reasoning [1] is, thankfully, accompanied by attempts to do something about it. A few months ago, Tamar Makin and Jean-Jacques Orban de Xivry published an excellent short article called “Ten common statistical mistakes to watch out for when writing or reviewing a manuscript” [2; link], motivated in part by pervasive problems that arise from a flawed understanding of statistics.
I’m a regular participant in our local Microbial Ecology journal club, where I often lament the use of p-values or grumble that a paper’s author list outnumbers its data points. This term, we’re going to explicitly bring up issues of statistics and statistical thinking because of a push by the NIH (U.S. National Institutes of Health) to improve this aspect of graduate student education. Statistical topics, they state, should be integrated into things like journal clubs attended by students supported on NIH training grants.
Journal clubs may be a great venue for enhancing statistical thinking, since they deal with real applications of data analysis, and are less formal and lower-stakes than classes. They may also be a good place to discuss the conceptual issues underlying statistics; I don’t know how much of this happens in biostatistics courses, courses I sometimes think do more harm than good. On the other hand, it takes work to integrate “lessons” into a journal club, work for which there’s no actual reward. (I.e. why am I writing this?) It’s interesting that Makin and Orban de Xivry write that their list “has its origins in the journal club at the London Plasticity Lab, which discusses papers in neuroscience, psychology, clinical and bioengineering journals.”
I thought I’d offer some bits of commentary on the “Ten Statistical Mistakes” article that might serve as a framework for short journal club discussions, or that people might find useful to read beforehand. Of the ten “statistical mistakes,” #1 and #10 are broad issues of experimental design, leaving eight topics of particular relevance to the theme of statistics in science.
Before starting, I’ll note a key point: statistical mistakes are almost never about math. Rather, they are about the concepts that underlie relationships between data, noise, and measurement. The solutions to the mistakes do not come from fancier equations or more elaborate software packages, but from clearer thinking that we all can strive for.
I’ll try to post something every week. We’ll see if that happens… Even if it does, these posts may be a bit rough.
Mistake #1: Absence of an adequate control condition/group
As mentioned, this is an issue of experimental design and isn’t very interesting for our purposes here. It’s important, of course. Have good controls!
Mistake #2: Interpreting comparisons between two effects without directly comparing them
To get a sense of this common and consequential, error, let’s take a step back. Every measurement has some noise associated with it, whether measurement error, variability of the system itself, or some other randomness. Often, people want some number that describes how likely it is that their measured value is “significant,” meaning far enough away from zero or some other reference point that it is unlikely to have occurred by chance. It is arguable whether this is a sensible thing to want, in contrast to actually evaluating the magnitude of the thing being measured and the uncertainty of our estimate, but for whatever reason biologists especially have become obsessed by significance testing and its icon, the p-value. I will assume that anyone reading this knows what a p-value is, or at least thinks they do, so I won’t provide a definition. By convention, p < 0.05, roughly speaking a less than five percent chance that a random distribution centered at the reference point would give measurements as far from the reference point as the observed data, is taken to mean that the observation is “significant.” As we’ll see later, this leads to all sorts of problems, but let’s return to the specific problem of Mistake #2.
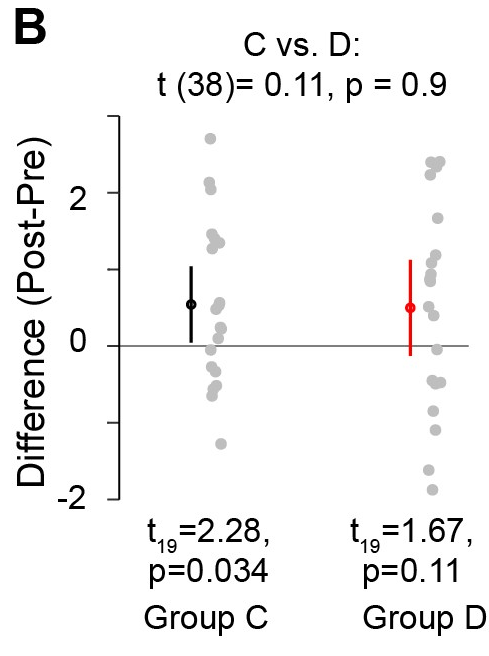
Makin and Orban de Xivry write, “Researchers often base their conclusions regarding the impact of an intervention… by noting that the intervention yields a significant effect in the experimental condition or group, whereas the corresponding effect in the control condition or group is not significant. Based on these two separate test outcomes, researchers will sometimes suggest that the effect in the experimental condition or group is larger than the effect in the control condition. This type of erroneous inference is very common but incorrect.” In other words, as illustrated in their Figure 1C (shown below), Drugs C and D may have the exact same average effect, but one may have greater variance, leading to one being “statistically significant” and the other not. This difference in “significance” has no relationship to differences in effect sizes, and provides no information about differences in effect sizes. (And, of course, the effect size is the thing one actually cares about.)
This problem is often commented on. As Andrew Gelman often notes, “The difference between significant and non-significant is not itself statistically significant”.
Discussion topic: Why would someone make this mistake?
One could say it’s due to misunderstanding what significance and p-values are, which is true, but this answer isn’t very illuminating.
My suggestion (feel free to skip over this) is that the error highlights what a poor tool significance testing is. A p-value isn’t telling us anything important about our data set per se, but rather about it’s relationship to some null model, and nothing else. These p-values aren’t even “transitive” — knowing “significance” for one set relative to the null and for another relative to the null doesn’t tell us about how these two sets compare to each other.
The fix for this mistake is easy: “Researchers should compare groups directly when they want to contrast them.”
Here are some exercises to help develop intuition:
Exercise 2.1 Create simulated datasets in which the treatment effect for “Drug C” is a Gaussian random variable with mean 0.7 and standard deviation 1.0, and the effect for “Drug D” has exactly the same mean but standard deviation 1.5. Suppose there are N = 20 datapoints for each treatment.
- (a) Simulating this many times, in what fraction of the trials are the “C” and “D” sets different in terms of “statistical significance” (i.e. p<0.05 for a one-sample t-test being true for one but not the other set)?
- (b) If N is much greater, what would you expect to happen to your answer to (a)? (You should be able to answer this without running your simulation.)
- (c) Run your simulation for a range of N; what do you find?
- (d) Was it important that the standard deviations of our treatment effects were different? What if Drugs C and D were exactly the same in their mean effect and its standard deviation. Would the answer to (a) be (i) the same, (ii) < 5%, because the distributions are identical, (iii) smaller, but not necessarily < 0.05, or (iv) larger? Make a prediction, and then run your simulation.
(I really do recommend doing the exercise! I did it…)
Exercise 2.2 [added Oct. 9, 2020] Sketch by hand, making up points, pairs of data sets in which each set is (i) “signficantly” different from zero but not from each other; (ii) “signficantly” different from zero and from each other; (iii) not “signficantly” different from zero but different from each other; and (iv) neither significantly different from zero nor from each other. All of these are possible; the goal of this exercise is to practice visualizing data.
[—-]
I wrote much more than I intended to here! I’ll try to restrain myself next time…
Update: Dec. 6, 2020. The series is complete!
Here are links to all the posts in the series:
- This post Mistake #1: Absence of an adequate control condition/group, and Mistake #2: Interpreting comparisons between two effects without directly comparing them
- Mistake #3: Inflating the units of analysis
- Mistake #4: Spurious correlations.
- Mistake #5: Small samples.
- Mistake #6: Circular analysis.
- Mistake #7: Flexibility of analysis: p-hacking.
- Mistake #8: Failure to correct for multiple comparisons.
- Mistake #9 and #10: Over-interpreting non-significant results, and Correlation and causation.
Today’s illustration…
Waves on a shore, based on the third part of this “How to Paint Waves” tutorial video. If I do manage to post every week, get ready for some mediocre drawings and paintings!
— Raghuveer Parthasarathy, October 6, 2020
References / Notes
[1] If you’re not familiar with this, this post is probably not for you! Still, you may want to read the references cited at the start of Reference [2].
[2] T. R. Makin, J.-J. Orban de Xivry, Ten common statistical mistakes to watch out for when writing or reviewing a manuscript. eLife.8, e48175 (2019). Link
