

Continuing from the first post in this series, let’s look at Makin and Orban de Xivry’s Statistical Mistake #3: Inflating the units of analysis. The issue: What is N? In other words, how many independent data points are there, for whatever statistical analysis one wants to do? N is often mistakenly made larger than it should legitimately be. How?
Makin and Orban de Xivry given an example using pre- and post- values for some treatment applied to individuals. I’ll give a different, and perhaps even simpler, example: Suppose there are two groups of people, A and B. We want to see if the two groups’ weights “differ significantly” from each other. Again, this is a terrible question to ask, since every group is different from every other. Really, the only meaningful question to ask is by how much do they differ, but let’s ignore that in this post. For each of the 20 people in each group we take three measurements, perhaps on different days to average over variation. The results are shown here, where each individual’s measurements are the same color, and are connected by lines. The individuals’ averages are denoted by solid circles. If we perform a two-sample t-test using each measurement separately, so N = 60, we find p = 0.03, i.e. “significant.” If we use each person’s mean value, so N = 20, we find p = 0.20, i.e. “not significant.” Which is correct?
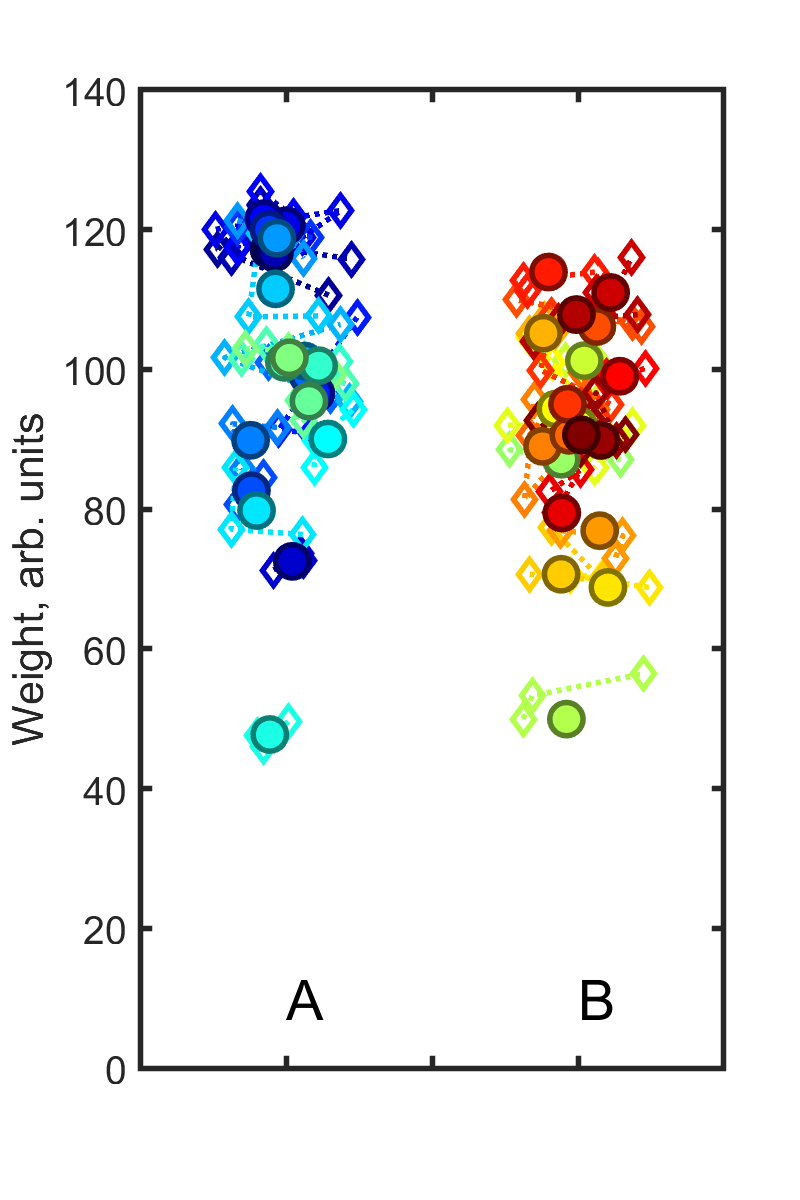
The latter analysis, of course, with N = 20, is correct. The repeated measurements of the same individual, while they help pin down that individual’s value, do not contribute independent data points with which to compare A and B.
Makin and Orban de Xivry point out that the fix to this mistake is to “consider the appropriate unit of analysis. If a study aims to understand group effects, then the unit of analysis should reflect the variance across subjects, not within subjects.” They also note that mixed-effect models are useful, “where researchers can define the variability within subjects as a fixed effect, and the between-subject variability as a random effect.”
About “the appropriate unit of analysis,” I’ll note that this isn’t always obvious. A good philosophy, however, is to be conservative, using the smallest and most robust measure of how much data you have. Does your conclusion actually depend on stretching N as much as you can? If so, you may want to rethink your study.
Discussion topic: As with mistake #2, why might someone make this mistake? What is its appeal? (Suggestion: note how p depends on N.)
Here are some exercises to help develop intuition:
Exercise 3.1 Create simulated datasets to illustrate this mistake. More concretely, reproduce the scenario of my example above, in which the mean value for the people in group A is 100 and group B is 85; the standard deviations of the individuals’ means is 20 in each case; and the standard deviation within individuals is 4 in each case. Simulate this 1000 times; what does the distribution of p-values look like for the “correct” and “incorrect” interpretations described above? Is the average p-value over the 1000 trials “significant” or “insignificant” in each case? In what fraction of trials is p<0.05 for one interpretation and >0.05 for the other? (Did I cherry pick my illustration from my 1000 trials?)
Exercise 3.2 An interesting place this issue arises is in the comparison of growth measurements. Imagine, for example, assessing whether some treatment applied at day 0 alters the growth rate of an animal, with the animals’ size measured at days 1, 2, 3, 4, … How does one assess the treatment effect? Come up with scenarios in which the researcher makes “Mistake #3.”
Today’s illustration…
Another attempt at waves on a shore.
— Raghuveer Parthasarathy, October 15, 2020
