

How does public funding for science work in the United States? How much money is there? Who gets it, and how? How much does a graduate student cost? Even normally, science funding is a rich topic worth exploring, and now, as the president is attempting to radically change the structure of science in the U.S. and drastically reduce its funding, understanding the present system, warts and all, becomes especially relevant.
I gave an informal presentation and led a discussion of science funding at the joint meeting of my and neighboring research groups yesterday. I thought I’d spend a small amount of effort translating the slides into a blog post — far less polished than the usual post, but hopefully not useless. I’ll put a link to the slides at the end. A few slides, plus inspiration, came from a great presentation to students about funding from Lucia Strader at Duke University, moving soon to the Salk Institute. (Check out this fascinating new paper from her group, on motion inducing protein condensates!)
Let’s begin! Again: this will be an informal post, with fragmentary text and little attention to formatting. I suggest reading the section titles and trying to answer each question before reading on.
Where does US research and development funding come from?

The majority of funding is from private industry (especially for applied research, development). I was surprised to learn this. (I blocked the “percent of GDP scale” — this will come up later.)
For basic research, the federal government is the largest contributor, but not by as large a margin as you might think:

A large chunk of industry-supported basic research is in pharmaceuticals and biotech (link). During the discussion, there was speculation that computer science / AI may also be a large component; I agree.
Why fund science through public means?
We had a short discussion of this; I’ll leave it to the reader to ponder the question. (Public goods, etc.)
About economic benefits / return on investment from basic science, a few slides mostly from Lucia Strader:


How is the amount of federal science funding determined?
(Partially from LS)

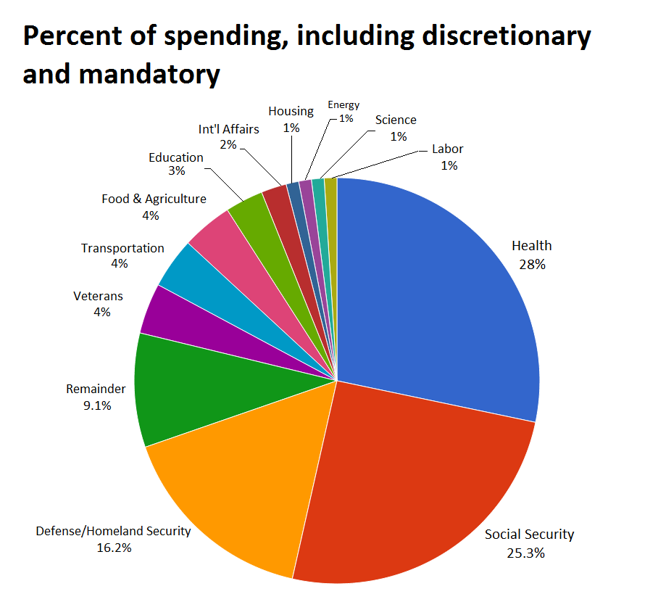
What does the US spend money on?
By far the biggest items are:
- Health (Medicare / Medicaid)
- Social Security
- Defense
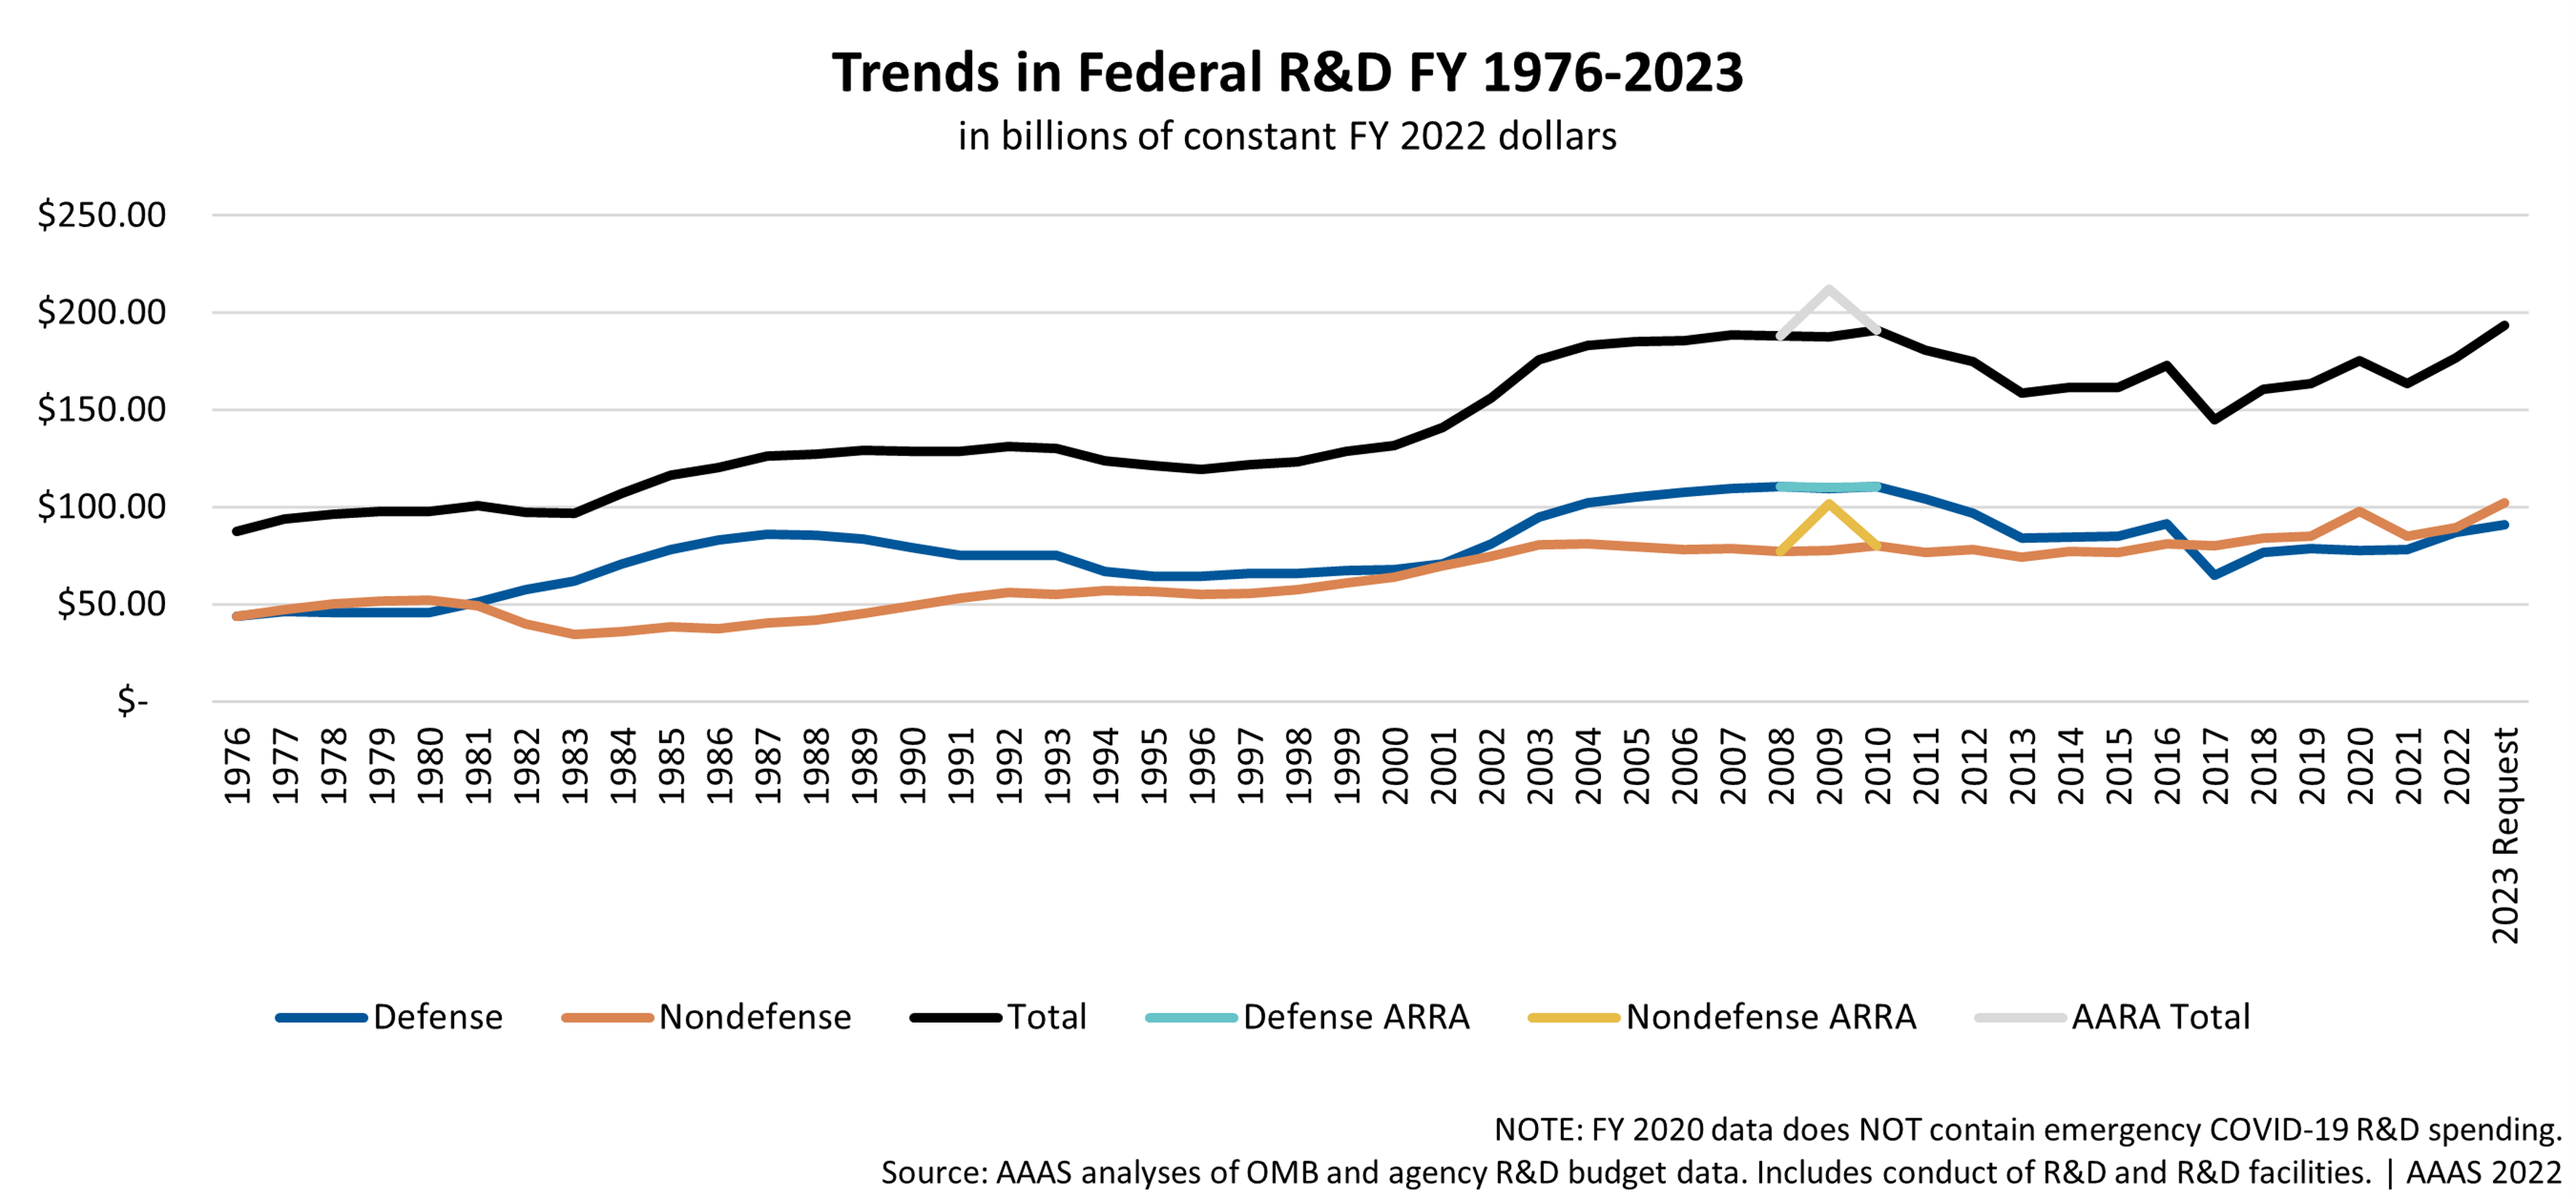
How much does the US Govt. spend on Research and Development (const. $)?
About $100B/year. In constant dollars, there has been a steady rise over the past four decades:
How much does the US Govt. spend on Research and Development (% of GDP)?
The research component has been quite steady at 0.4%. Overall, there’s a decline over the past thirty years:

How does US research funding compare to other countries’?
Quiz questions! These were interesting to ask the audience — try it!
Of the following, which country spends the highest fraction of its GDP on research (total spending, not just government)?
- The United Kingdom
- Singapore
- The United States
Here’s a photograph as a spacer, so you don’t immediately see the answer…

Answer: The United States
Which of the following countries spends more of its GDP on research than the US (total spending, not just government)?
A. Germany
B. The Netherlands
C. Australia
D. None of the above
Answer: None of the above
The US is #4 among countries for overall research and development spending as a percentage of GDP, at 3.59% :
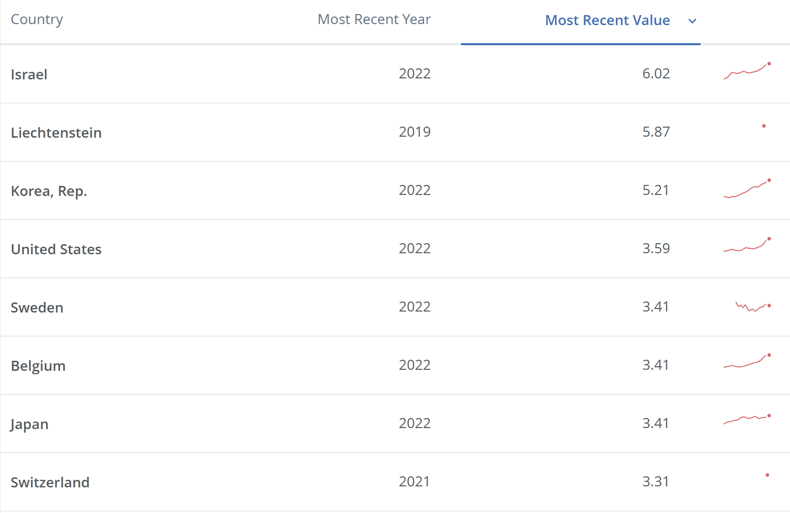
Really we’re #3 — I’m fond of Liechtenstein, but it shouldn’t count…

Other countries:
Israel: 6.02% (Rank #1)
UK: 2.90%
Singapore 2.16%
Australia 1.86%
China: 2.56% (and rising)
Brazil: 1.15%
India: 0.65%
Chile: 0.36%
Canada is a surprising one, given its overall similarity to the United States: 1.70% ! About half the US value.
However, it’s important to keep in mind that these numbers include defense-related research. I’d guess that a sizeable fraction of the US-Canada difference is defense-related, but I have no idea how much — I’d love to know!
Where does federal research funding go (agencies)?
Note that the NIH (National Institutes of Health) is within HHS (Health and Human Services).

How much of US research funding goes to universities?
About 30%; 60% of non-defense spending. For the NSF (National Science Foundation) in particular, it’s 79%.
(Details: “In FY 2023, federal dollars supported $59.6 billion of university R&D expenses.” Source. NSF (https://nsf-gov-resources.nsf.gov/2023-03/01_fy2024.pdf).)
Research at the University of Oregon (UO): Funding
UO: $146M federal grants (FY23)
NIH to UO: $55M (2023)
For scale: tuition revenue FY23 was $456M; the State of Oregon provides $115M to the university. (We’re highly dependent on student tuition for our revenue. This is true of most public universities, but Oregon is worse than most states; see e.g. the graphs here.)

How do you (and I) get this money?
The question I’m sure you’re all wondering!
I and others elaborated on these steps:
1 Have a great idea.
2 Look for relevant funding agency programs, divisions (e.g. NSF Physics of Living Systems)
3 Write a proposal!
I’ll return to the next steps in a moment.
Parts of a grant
- Summary / Abstract (for the public)
- PI Biosketch
- Specific Aims page
- Proposal
- Environment / Equipment
- Documentation of animal welfare, human subjects, data availability, authentical of key reagents
- Budget
(From LS. THis is the NIH format. NSF is similar.)
How do you (and I) get this money? [Continued]
1 Have a great idea.
2 Look for relevant funding agency programs, divisions (e.g. NSF Physics of Living Systems)
3 Write a proposal
4 Submit the proposal
5 Wait (about 6 months, sometimes more)
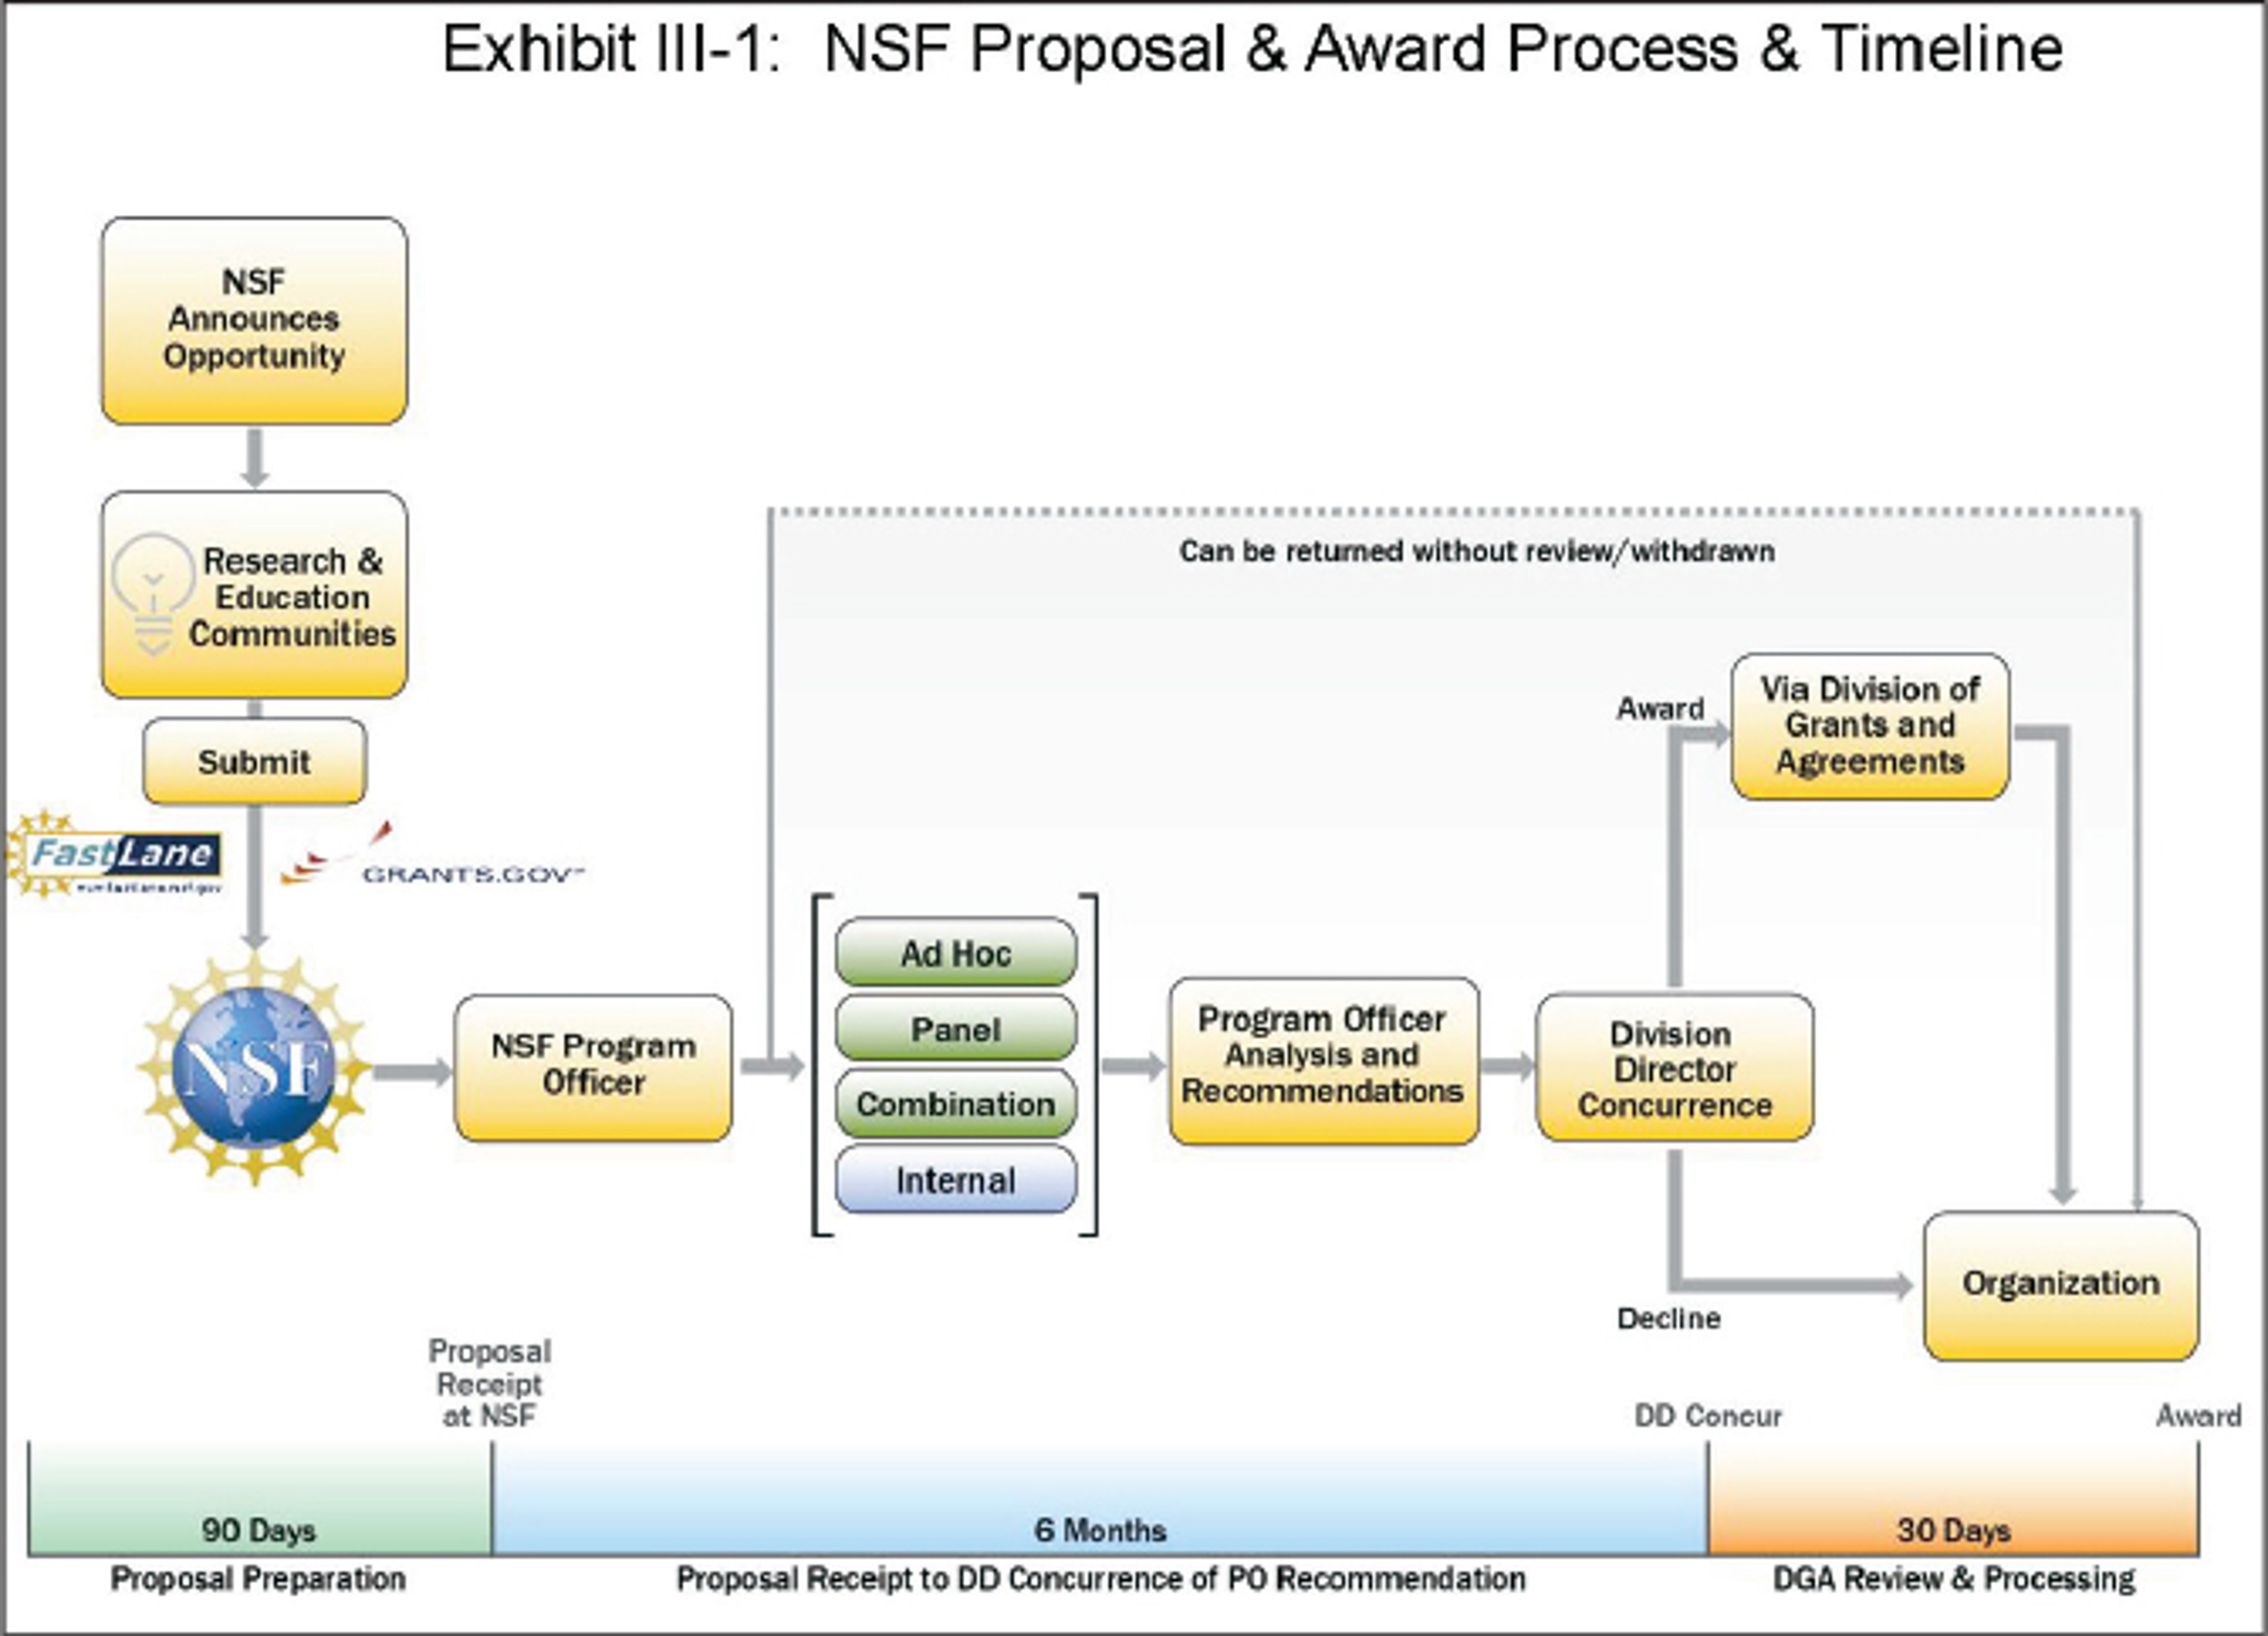
Grant Evaluation
NSF Panel
- Assigned to a review panel
- Two merit review criteria: intellectual merit and broader impacts.
- 3 reviewers; score Excellent / Very Good / Good / Fair / Poor
- 20-30 minute discussion; reviewers + panel
- Panel categorizes: Outstanding / Highly Meritorious / Meritorious / Not Recommended
(We discussed who’s on the panels; expertise; etc.)
NIH [from LS]
- Assigned to study section
- 3 reviewers
- 20-30 minute discussion
- All study section members give it a score (1-9)
What are the odds?
NSF Mathematical and Physical Sciences: 25% funding rate
NIH R01 and similar grants: about 20%

Where does the money go?
Direct vs Indirect Costs
- Direct – put into account for PI (principal investigator)
- Indirect – (a.k.a. facilities and administration) taken by the university (typically ~50%, can be over 100%); 61% at Duke; 47.5% at U. Oregon
Direct vs Indirect Costs
- Direct – put into account for PI (principal investigator)
- Indirect – (a.k.a. facilities and administration) taken by the university (typically ~50%, can be over 100%); 61% at Duke; 47.5% at U. Oregon
The indirect cost percentage is expressed as a percentage of direct costs so a “50% rate” means for that for every $1 of funding, $0.67 goes to the lab’s direct costs and $0.33 goes to the university.
Indirect costs pay for: utilities (electricity, etc.), admin (e.g. MSI staff), core facilities (partially subsidized), other admin (tech transfer, …), etc.
How much does it cost to run a lab?
How much does one UO grad student cost to a grant? (The grad student salary is about $30k/year.)
Guess!
How much does one UO grad student cost to a grant?
- $30k salary [revised later w/ current rate].
- $13k benefits.
- $5.5k in tuition (post-candidacy), about $13k pre-c.
- $49k / in direct costs ($69k in total costs) [post-candidacy students!]
- $56k / in direct costs ($76k in total costs) [pre-candidacy students!]
How much does one UO postdoc cost to a grant?
- $58k salary. $30k benefits = $88k in direct costs ($130k in total costs)
Then there’s the costs of supplies, equipment, conference fees, travel, publication fees, etc.
A typical NSF grant provides about $200k/year. (3 year duration.)
What’s happening recently (Feb. 2025)?
- Trump administration: cap indirect cost rate at 15% (February for NIH; later DOE, NSF).
- Blocked by courts: changing rates requires Congress, violates prior agreements.
What’s happening now (June 2025)?
- Trump’s proposed budget: Massive cuts to
“US National Institutes of Health (NIH) would lose roughly 40% of its budget compared with 2024 levels, and NASA would be pruned by about one-quarter — but the NSF would lose a whopping 57%, taking its roughly US$9-billion budget down to $3.9 billion.” Nature, June 5, 2025; https://www.nature.com/articles/d41586-025-01749-x
But remember:
The appropriations process! (see the earlier image.)
We’re still in the middle of it, though it was noted that the House has approved Trump’s budget.
Still, as a glimmer of positive thinking:
What happened in 2017?
- And also remember 2017; Trump I’s proposed FY2018 budget: 20% cut to NIH, 11% cut to NSF.
- The actual budget (Congress): $3B increase in the NIH budget; NSF roughly unchanged.
What’s next?
Here’s a link to a PDF of the slides. (Edit: PPT might be more useful — email me! raghu [at] uoregon.edu )
Today’s illustration…
A flower. Like this post, hastily done.
— Raghuveer Parthasarathy, June 10, 2025

Excellent overview. I’m curious about the section “What are the odds?”. Does the success rates mentioned there mean per application, or per submission. In other words, if I submit my proposal, then submit a revision, and then another revision, is my ultimate success rate 20%, or is my success rate on each submission 20% (making, by my estimation, a net success rate of about 50%). My impression is that 20% is the ultimate success rate, but some of your conclusions surprised me, so I don’t trust my intuition.
By the way, I loved the Liechtenstein photo.
Great question! I think this 20% NIH rate is per submission, so yes, re-submission increases the (eventual) odds considerably, though the likelihoods are undoubtedly correlated! (Link) However, it’s also the case that the success rate is institute-dependent. For NIGMS — basic science, the relevant one for most of us — it’s about 14.4% (link).
It was fun to visit Liechtenstein! (I was in Switzerland, and felt that I had to go…) The photo is taken from a hike in Switzerland.
Some good insights here! I especially appreciated the discussion around the ‘return on investment’ for basic research. A few thoughts on the metrics used in the post:
Thanks! I hadn’t heard of GERD — this looks great! I’m confused by the GERD-to-GDP ratio, though — it seems inconsistent to normalize the research expenditure by PPP (for the numerator) and not normalize GDP by PPP (the denominator).
About #3: Yes, I agree. Lab tech costs are fairly similar to postdocs, though, so that’s easy to think about. Undergrads vary a lot; an undergrad research assistant being paid for 20 hrs/week for a full year at $15/hr would be about $16k, or $24k with indirect costs, which is about 1/2 to 1/3 of a graduate student. In any case, all of this highlights that the major cost for most grants is people, which I’m sure you know, but which is not obvious to students and (I think) the public.
GDP is normalized too, from one of the tables on that page “Foreign currencies are converted by the Organisation for Economic Co-operation and Development (OECD) to U.S. dollars using PPP.”
I assume this is varies widely labs working doing human trials the facilities cost and overheads might be comparable to researcher salaries.