
 For months I’ve been intending to write about a fascinating and frightening 2018 paper on the “half-life” of scientists — how long scientists remain in the scientific workforce. I was reminded of this recently by an excellent paper comparing the impact of small and large research groups on science. The two papers should perhaps be thought about together, especially if they’re to impact how we structure science.
1. Half-lives
The Proceedings of the National Academy of Sciences featured a few months ago several articles on the study of science and technology — “Modeling and Visualizing Science and Technology Developments.” Some were awful; some were great. One of the great ones was “Changing demographics of scientific careers: The rise of the temporary workforce” by Staša Milojević, Filippo Radicchi, and John P. Walsh. The authors asked how long scientists stay in science. We all know that many people trained as scientists don’t remain scientists, often despite their skills, interests, or desires. We train many more Ph.D. students than there are academic positions for, and in many fields non-academic research positions are rare. Large numbers of researchers are funded by precarious “soft” sources of money; their jobs disappear when funding ceases. Can we quantify the transience of scientists, and see how it has changed over time?
Milojević and colleagues used paper authorship as a proxy for existence. If someone is an author on research papers published in 1998, 2002, and 2005, she’s presumably a scientist throughout this period. If she never appears on an author list from 2006 onward, she’s presumably left science. We can ask, for the “cohort” of scientists whose first publication appeared in a given year, the average number of years they continued to appear as authors on papers, and we can use this as an estimate of persistence in science. The hypothetical scientist in our example above persists from 1998 to 2005. There are, of course, limitations to this measure, but I think overall that it’s very reasonable.
For each of the three fields the authors examined — astronomy, ecology, and robotics — Milojevic and colleagues quantified the decline in the fraction of scientist remaining in their field over time:

For astronomy, for example, about 85% of the 1986 cohort “survived” to 1993, while about 50% of the 2006 cohort survived to about 2013, an equivalent 7 year span. From the above graphs, it’s clear that this rate of decline has become stronger over the past few decades, in each of these fields. Plotting the half-life (the time for half the cohort to abandon their field) versus the cohort’s starting year is stunning:
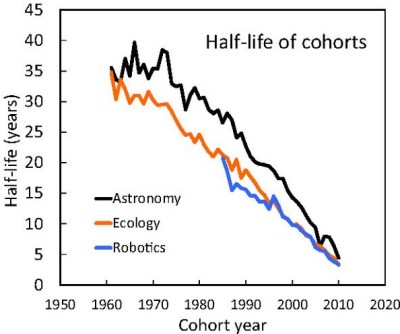
The median ecologist who started their career in 1970 could expect good odds of still being an ecologist 30 years later; by 1990 that lifetime had collapsed to less than 20 years, and for the 2010 cohort five years. The trends are similar for the other fields. The data not only support what we’d guess by anecdote, but they’re even stronger than what I would have predicted. The precariousness of jobs in science, or the lack of post-studentship positions, is remarkable.
Why should we care? I’ll return to this below.
There’s a lot more to the paper involving, for example, analyses of numbers of “lead” authors versus transient authors, some of which involves field-specific conventions of authorship, but the interesting trend is the “lifetime” decay noted above, which is very strong and independent of other issues of authorship.
2. Small groups
Science is done by groups large and small, from particle physics collaborations with thousands of researchers to single scientists puzzling over problems. Do differences in group size lead to differences in scientific impact? This is an interesting and important question, but a difficult one, since impact is notoriously hard to measure.
In a recent paper, Wu, Wang, and Evans tackle this question with a clever approach, taken previously in the context of patents, to assess how “disruptive” a scientific paper is (“Large teams develop and small teams disrupt science and technology,” Nature 566, 378-382 (2019)). Consider paper X, which cites various past papers. It is also cited by future papers. If the future papers cite X without also citing many of the papers that X cites, it suggests that X has made novel insights or discoveries, opening up a new area of research. Conversely, if the future papers cite X together with the papers X cites, X may be confirming past work or consolidating a chain of investigations. The relative presence or absence of persisting citations is therefore a measure of how “disruptive” (the authors’ word) a paper is. One can then look at this Disruption Index for a large number of papers, seeing how it varies as a function of how many authors a paper has.
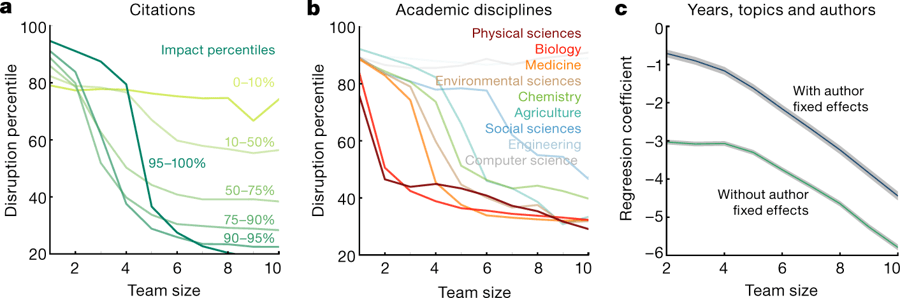
Examining 24 million papers, Wu and colleagues find that the disruption index of a paper decreases with the number of authors. In other words, smaller groups tend to create more innovative work, and larger groups less so:

The trend applies to nearly all fields (see below, middle), and also holds when controlling for the overall number of citations (below, left), as well as many other controls. The trend also holds holding authors fixed — in other words, examining the difference in disruption index for the same author if he/she is part of a few-author and a many-author paper (below, right).
This paper has gotten a lot of well-deserved press. One of the things I especially like about it is that it contributes something positive to the generally frustrating topic of research metrics. There’s a lot of interest, mostly misguided, in developing quantitative measures of research output. The number of citations a paper or an author has is one example. A depressing variant on this is “citations per dollar,” which the NIH (National Institutes of Health) is fond of, proudly displaying this even to compare small sets of projects for which one would hope they’d assess the actual scientific outcomes rather relying on a blunt metric. The “disruption index” of Wu et al. at least provides a measure that might better distinguish different varieties of impact, and different types of innovation, that are not captured by presently used measures. More cynically, given that metrics will probably often continue to be mindlessly applied, it’s good to have a variety of them available so that one can cherry-pick the one that matches one’s aims!
Structuring Science
What do these two papers have to do with one another? Roughly, the first tells us that an increasing fraction of people trained as scientists rapidly leave science. The second tells us that small groups tend to be disproportionately responsible for innovation. However, small groups are precisely those that are hardest to sustain. This is simply small number statistics; relative fluctuations are large when N is small. In an era in which funding rates are low, money is hard to predict, and its randomness can easily drive a group to extinction. A large group with many projects can average over this; a small group cannot.
One worries, therefore, that the decline in the lifetime of scientists is especially depleting the pool of small groups. Of course, the lifetimes are of individuals, and the disruption index tracks with the size of groups, roughly independent of individuals. Nonetheless, as an important question in itself, it would be fascinating to investigate the correlation between disruption index and individual persistence in science. Are the scientists who produce more innovative output more or less likely to remain scientists? Has this changed in recent years? The data are out there, and perhaps the authors of the two papers I’ve described could combine their datasets to easily answer this! I’d love to read the resulting paper.
More broadly, these articles relate to the issue of how to structure the scientific enterprise. I’ve long thought that a system in which there were more long-term jobs (rather than studentships), more stable funding, and fewer scientists would be better for both scientists and science. There doesn’t seem to be much will on the part of agencies like the NSF to do anything about this, unfortunately. (My NSF “Big Ideas” proposal on “A Sustainable Scientific Enterprise” was rejected; I’m curious to see the winning topics.) Perhaps with more studies like those described above, change will happen.
Today’s illustration…
An octopus tentacle. Painting this was inspired by Sy Montgomery’s “The Soul of an Octopus,” which I recently read. My painting is based on a photo I found online, but I neglected to save the URL. (Found it! source.)
— Raghuveer Parthasarathy, March 14, 2019

Interesting post, as always, Raghu. Another interesting way to mime the first set of data would be by gender (where possible) – I wonder how the half-lives of underrepresented groups compare with the mainstream. It would offer new insight into the diversity question. (Other aspects of diversity would be great to study in this way, too, but harder to recognize from their names.)
I agree that this would be interesting to see! I’m not sure of what I’d expect the answer to be, however. My rough impression is that people from underrepresented groups leave earlier in the pipeline (for a wide range of reasons), but being white and male is at the moment a notable disadvantage at the stage of getting a faculty offer (relative to population).
There is a much earlier treatment of some of this, one which brings up precisely the problems arising from exponential growth, in a book by H. W. Menard: Science, Growth and Change (Harvard University Press, 1971). It looks to me as though the half-life values start to decline at just about that time–exactly when the postwar funding boom came to an end,
Thanks for the pointer! I think many of our issues stem from structures created during the postwar boom that are not well suited to a stable (or less-than-exponential-growth) state. For example: using universities graduate students, to provide a large pool of researchers.