
 Which University of Oregon department saw its number of undergraduate degrees awarded per year plummet from 82 in 2004 to 22 in 2008, before rebounding to 85 in 2017?
The answer is among many that can be gleaned from UO’s excellent Office of Institutional Research website. After conversations in my own department (Physics) about numbers of majors, I found the institutional research page on which one can find data on degrees awarded, in tables as well as in nice graphs. (Link; Click the “Degrees by Major” tab.) For the mystery department above, for example:
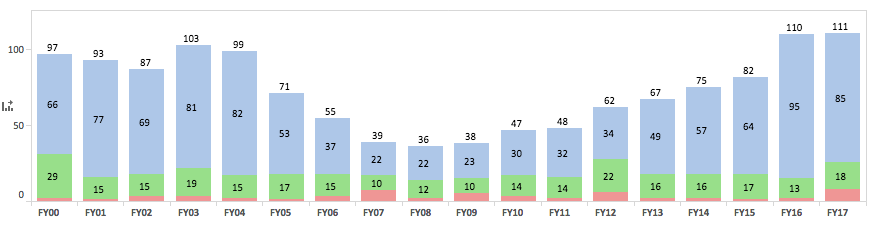
with the legend:

Have you guessed yet? …
(I’ll pause for a minute.)
It’s Computer and Information Science. It’s fascinating to look at different fields and learn about their numbers and their trends. The majors don’t necessarily map onto departments — UO’s Chemistry and Biochemistry Department, for example, offers distinct Chemistry and Biochemistry degrees, tabulated separately — but for many departments, one can get a sense of how many students are in its programs from a simple look at the data.
It’s fun to look at the graphs, and I’ve pasted ten of them into a quiz! See how you do! If you’re not at the University of Oregon, you can still play along, since the trends are likely indications of general trends in interests and attitudes across society, rather than things particular to UO. If you’re at another University, you can try finding similar information for your school, and compare.
For scale: UO has about 20,000 undergraduates and 3600 graduate students. As one point of calibration: Psychology is the second most popular undergraduate major, with 6-8% of degrees conferred (source; source).
Ready, Set, Go! You’ll have to note your responses yourself, and compare to the answers at the bottom (under “Today’s Illustration”); I’m not bothering to figure out how to make an interactive, automated quiz.
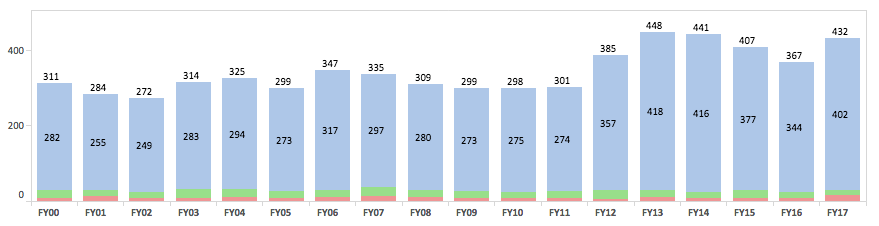
Graph #1

1. Is this major, showing almost the opposite of the computer science trend, …
A. Biology (not including Marine Biology)
B. Economics
C. History
D. Theater arts
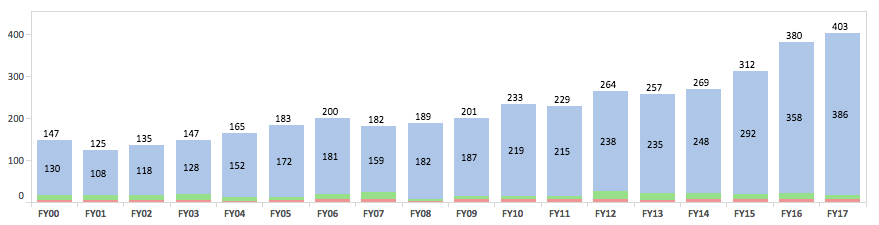
Graph #2
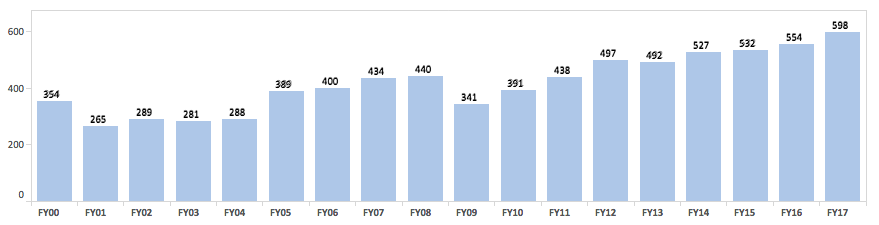
2. Is this major, characterized by a large undergraduate enrollment, …
A. Business Administration
B. General Social Science
C. History
D. Human Physiology
Graph #3
 3. Sticking to STEM, …
A. Biology (not including Marine Biology)
B. Mathematics
C. Physics
D. Psychology
Graph #4
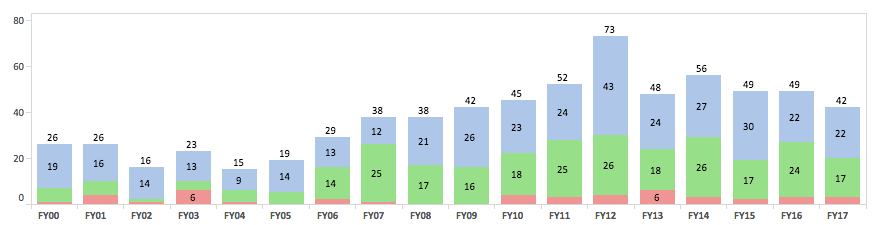 4. Note the large fraction of Master’s degrees. Is this…
A. English
B. Linguistics
C. Mathematics
D. Physics
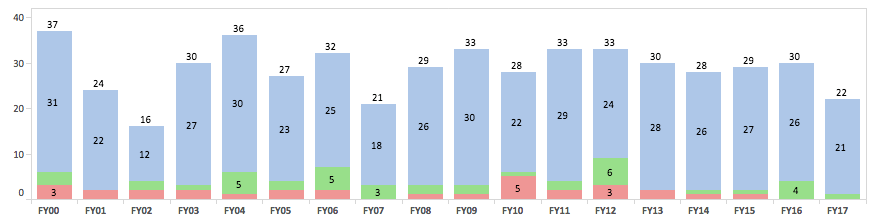
Graph #5

5. Note the large fraction of Ph.D. degrees. Is this…
A. English
B. Linguistics
C. Mathematics
D. Physics
Graph #6

6. Is this…
A. Economics
B. Mathematics
C. Physics
D. Theater Arts
Graph #7
7. Is this…
A. Economics
B. English
C. Linguistics
D. Theater Arts
Graph #8
8. Here’s a tough one. Is this…
A. Business Administration
B. Economics
C. Human Physiology
D. Psychology
Graph #9
9. An increasingly popular major. Is this…
A. Economics
B. English
C. History
D. Physics
Graph #10

10. We’ll end with a strange one…
A. Business Administration
B. General Social Science
C. Human Physiology
D. Linguistics
Today’s illustration
Part of a kinesin protein that I drew for something else. In how many of the majors shown above might you encounter this molecule?
Answers:
Here are the answers, without commentary.
1: C [History]
2: A [Business Administration]
3: A [Biology]
4: B [Linguistics]
5: D [Physics]
6: B [Mathematics]
7: D [Theater Arts]
8: D [Psychology]
9: A [Economics]
10: B [General Social Science]
— Raghuveer Parthasarathy. October 16, 2018

Raghuveer:
This is a great quiz. I just wish they’d plotted these data using lineplots rather than barplots. And all those little numbers . . . ugh! If plotted well, we could graph all those plots in a single page.
Thanks! There are many (and perhaps better) ways to plot the data, but regardless I’m thrilled that our Institutional Research department makes the data available and provides clear, good graphs. The little numbers are annoying to look at, but they’ve saved me in a few cases from having to look elsewhere for the values. It would definitely be neat to see all the plots together, both raw values and scaled, e.g. by the year 2000 value.