
 Machine learning is everywhere these days, as we train computers to drive cars, play video games, and fold laundry. This intersects my lab’s research as well, which involves lots of computational image analysis (e.g.). Nearly everything my students and I write involves writing or applying particular algorithms to extract information from data. In the past two years or so, however, we’ve dipped our toes into some problems that may be better served by machine learning approaches. (I explain the distinction below.) “We” was really Matt Jemielita, a recently-graduated Ph.D. student (now off to Princeton), who applied basic machine learning methods to the classification of “bacteria” and “not-bacteria” in complex images.
Given all this — its relevance to the contemporary world and to my research — I thought I should dive more systematically into understanding what machine learning is and how to apply it. I’m certainly not an expert on the subject, but here’s an account of how I went about exploring it. This will be continued in Part II, which will go into why I’ve found the topic fascinating and (probably) useful as a framework for thinking about data. Also in Part II, I’ll give an example of machine learning applied to analyzing some “real” images. In Part I, I’ll mostly describe how I learned about learning, and all you’ll get as an example is a silly schematic illustration of identifying fruits.
1 Starting 34th grade
My usual approach when learning new topics is to read, especially from a textbook if the subject is a large one that I want to cover systematically. This time, however, I decided to follow a course, watching pre-recorded lectures on-line and doing all the homework assignments and exams. The class is “Learning from Data (CS156),” taught at Caltech by Professor Yaser Abu-Mostafa (see here for details: https://work.caltech.edu/telecourse.html). It’s a computer science course, intended for a mix of upper-level undergraduates and lower-level graduate students. All eighteen lectures are available via YouTube, and the course was explicitly designed to be made publicly accessible. I had read good things about the course on-line. I can’t really remember how I picked it over another popular machine learning course, Andrew Ng’s at Stanford, but I did notice that the videos of the Caltech course were aesthetically more pleasant. (The professor has very nice color palettes of shirts and jackets and ties. I briefly wondered if I should wear ties when lecturing in my own classes — but only very briefly.)
The course was excellent: clear, interesting, and well-organized. It’s well known that viewership of on-line courses and lectures drops precipitously as the course goes on, and this appears to the case for this class as well, at least as measured by YouTube views of each of the lectures:
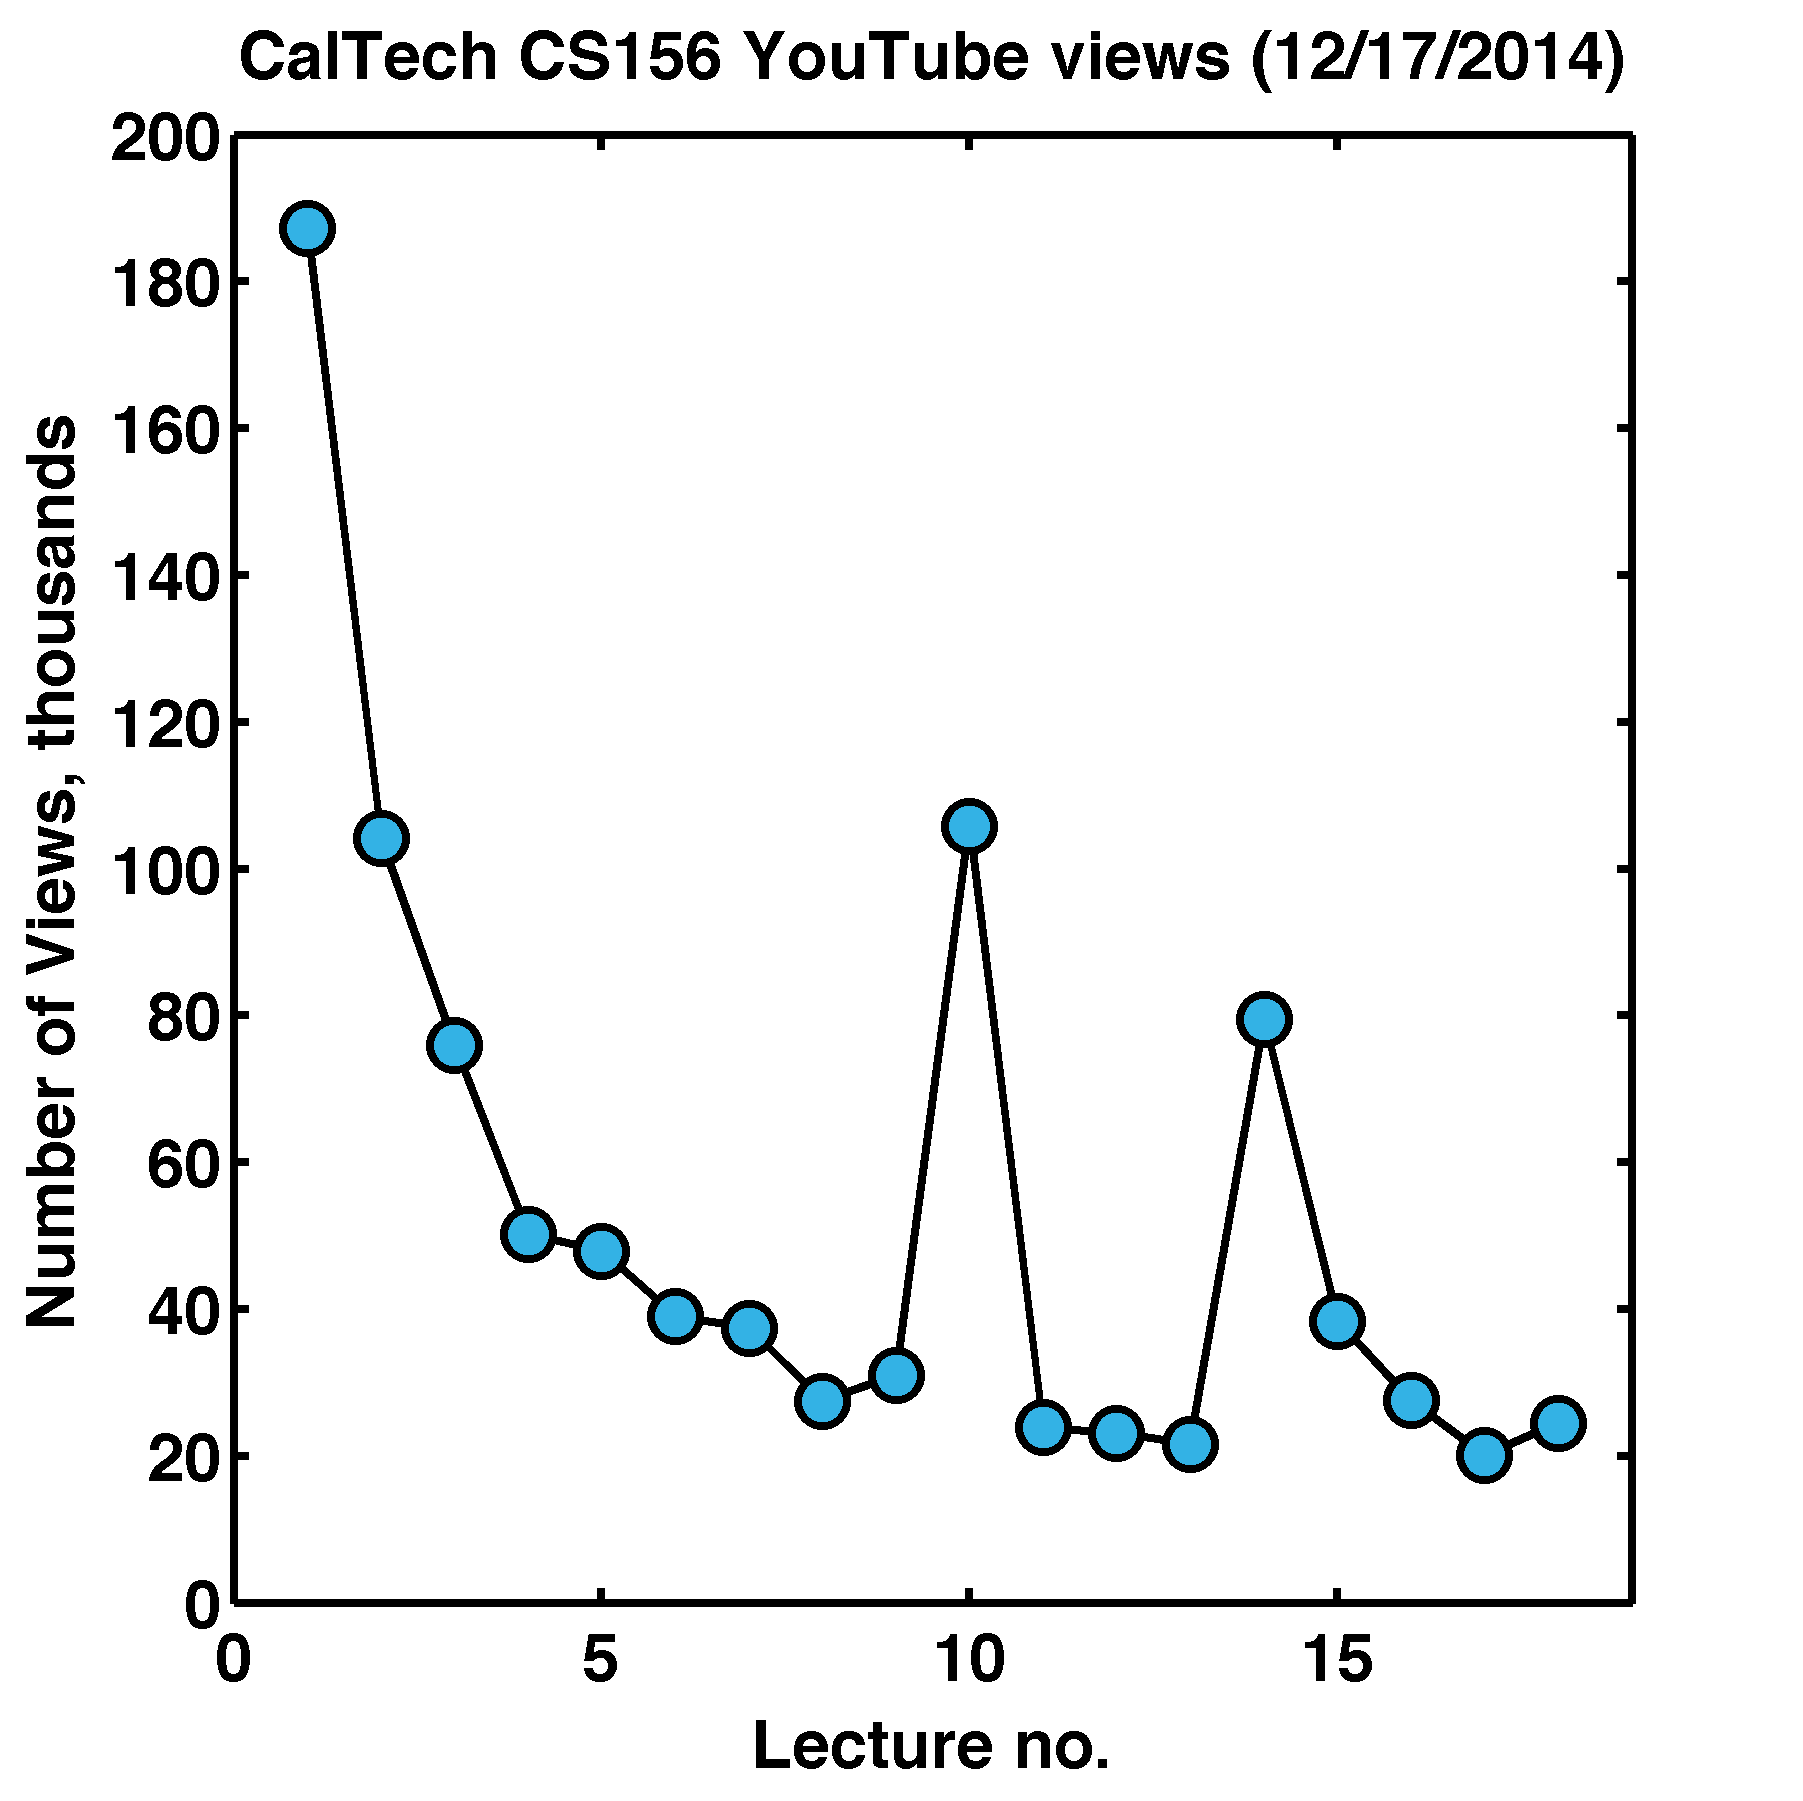
My own rate of progress was very non-uniform. I started the course during the 2014-15 Winter break, when I had relatively large amounts of time; I finished close to half the course in three weeks (plotted below). Then, when the academic term started, time became more scarce. When the Spring term started — and I was teaching a new biophysics graduate course — large blocks of time to spend on machine learning essentially disappeared. I finally watched lecture #18 in June, about four months after lecture #17! It was September before I finished the final exam. Still, I did it, and I managed to average about 90% correct on the homework assignments, which generally involved a good amount of programming. I scored 100% on the final exam.

2 Active and Passive Learning
The lectures, as mentioned, were great — clear and focused, while also projecting a warm and enthusiastic attitude towards the subject and the students. It’s interesting, though, that they were vastly different in style from the classes I teach. They were purely lectures, without any “active learning” activities — no clicker questions, no interactive demonstrations, no discussions with one’s neighbors (which in my case would have involved me either pestering my kids or random people at a café). Though I’m a great fan of active learning, I have to say that this was wonderful. How do I reconcile these thoughts? It’s important to keep in mind that one of the main effects of active learning methods is student engagement — not just getting students interested in the topic, but getting them to retrospectively and introspectively think about what they’re learning and whether they understand it. However, one of the reasons adopting active learning methods when teaching seems, at first, odd is that many of us who have succeeded as academics are the sorts of people who independently do this sort of thinking. I watch the lectures; I take notes; I re-examine the notes and think about the logic of the material; I reconstruct the principles underlying homework questions as I work on them; etc. (Normally I might also think of questions to ask, but that’s not really feasible here.) With this approach, a “straight” lecture is not only fine, but it’s extremely efficient.
3 Machine Learning and Classification
So what exactly is machine learning? In essence, it’s the development of predictive models by a computer (“machine”) based on characteristics of data (“learning”), in contrast to models that exist as some fixed set of instructions. Very often, this is applied to problems of classifying data into categories; in machine learning, the goal is to not have an a priori model of what defines the category boundaries, but rather for the algorithm to itself learn, from the data, what classifiers are effective.
Here’s an example: suppose you had a bunch of pears and bananas and wanted to identify which is which from images. Your program can recognize the shape and color of a fruit. Imagine that for each of many fruits you were to plot the fruit’s “yellowness” (perhaps red/green in an RGB color space) and some measure of how symmetric it is about its long axis. In general, bananas are yellower and less symmetric than pears, so you’d expect a plot like this:
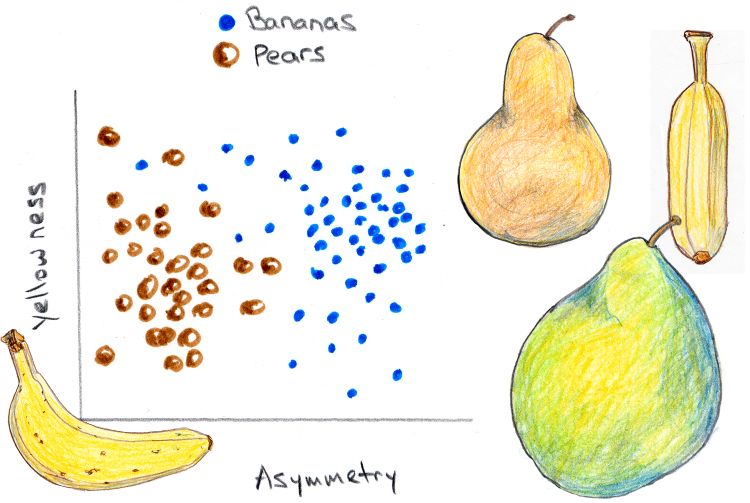 There’s a lot of variation in both sets of points. Some pears are yellower than others, and while nearly all bananas are curved, some views of them will appear more symmetric than others. Nonetheless, we can easily imagine drawing a curve on the plot that does a good job of separating the pears from the bananas, so that if we encounter a new fruit, we can see where in the partitioned landscape its symmetry and yellowness lie and decide from that what fruit it is.
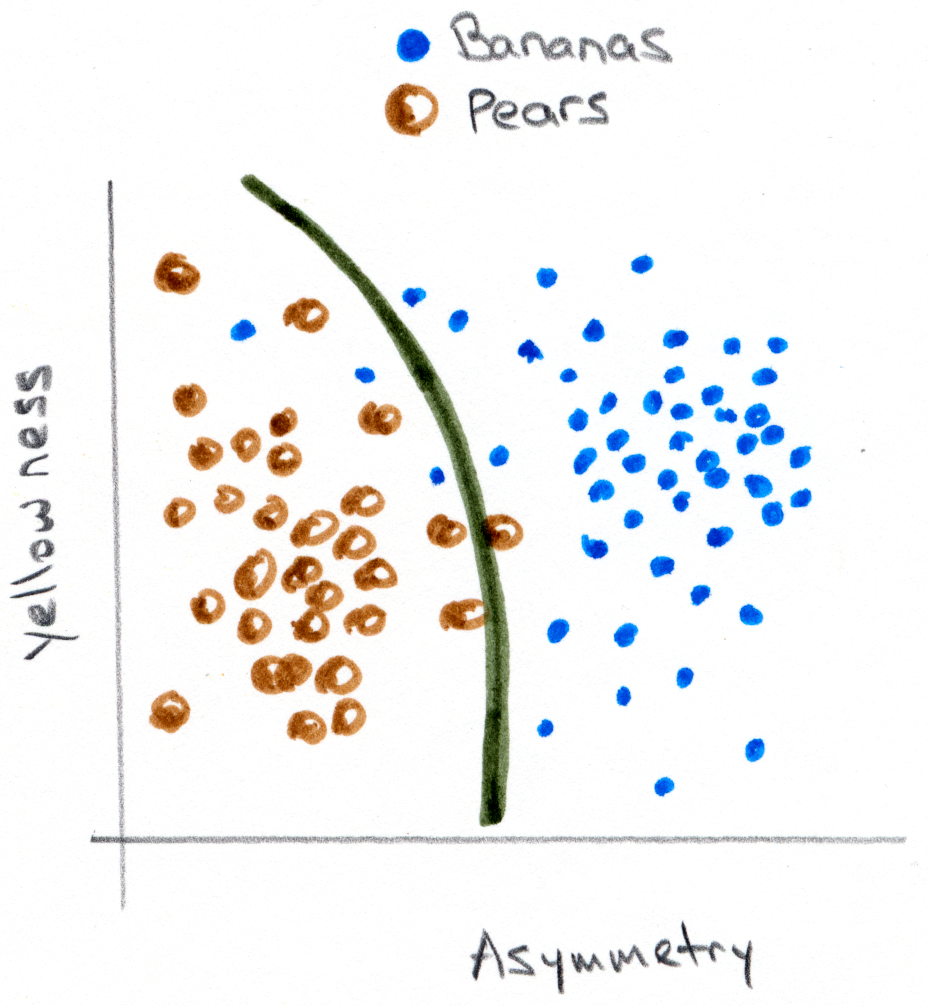 The goal in machine learning is to have the computer, given “training” data of known pears and bananas, determine where this boundary should be. This is quite different from the usual approach one takes in analyzing data, which is more akin to figuring out ahead of time some model of banana and pear morphologies and appearances, and evaluating the observed image characteristics relative to this model. (To give a less convoluted example: imagine identifying circles in images by applying what one knows about geometry, for example that all points on the circle are equidistant from the center. A purely machine learning approach, in contrast, would consist of training an algorithm with lots of examples of circles and not-circles, and letting the boundary between these groups form wherever it forms.) Roughly speaking, the non-machine-learning approach is “better” if it’s feasible: one has an actual model for one’s data. However, there are countless cases for which it’s too complicated or too difficult to form a mathematical model of the data of interest, but for which abundant examples on which to “train” exist, and that’s where machine learning can shine.
Even in the contrived example above of bananas and pears, we can see from the graph that it’s not actually obvious how to draw the separator between the two fruits. Do we draw a line, or a curve? A gentle curve, which leaves some data points stranded in the wrong territory, or a convoluted curve, which gets the training data exactly “right,” but seems disturbingly complex for what should be a simple classification? Considering these dilemmas is central to the practice of machine learning. Since this post is getting long, I’ll save that for Part II, in which I’ll also show a “real” example of applying machine learning to a task of object classification in images. I’ll also try to describe why I’ve found exploring this topic worthwhile — beyond its practical utility, it provides a nice framework for thinking about data and models.
Today’s top-of-the-post illustration is Mega Man, by S. (age 6). Mega Man is a robot who looks like a boy. In the innumerable comic books my kids have read about him, I don’t think machine learning algorithms are discussed. I could be mistaken, however.
To be continued… [Part II]
