
This week’s Economist has a fascinating map of the number of UFO sightings per capita, by state:

When I saw this last Friday, it raised a few questions:
- What’s up with Washington?
- How well do UFO reports correlate with population density? (Do aliens have a fondness for sparsely settled, wide-open spaces?)
- Could I use any of this for group meeting this past week, in which my and Eric Corwin’s labs were continuing our exploration of good graph design?
To answer the first two questions, and possibly the third, I downloaded the UFO sightings data from the National UFO Reporting Center — an entertaining site. Population data is easy to find from the U.S. Census Bureau. Here’s UFO sightings vs. Population Density:

It’s not a bad trend! Washington is clearly an outlier. (I colored Oregon green, by the way.)
My wife and I brainstormed various other variables against which to plot the UFO data — latitude? education level? Inspiration finally struck: Sasquatch!
Thankfully, the Bigfoot Field Researchers Organization tabulates Sasquatch sightings, making it fairly easy to plot UFO sightings per capita vs. Sasquatch sightings per capita (Oregon is yellow):

Eureka! (Washington, by the way, is the data point in the upper-right.)
It’s hard to avoid the conclusion that Sasquatch is, in fact, an alien.
How can I plot all these data together? I could make some unenlightening 3D plot, but another approach would be to revisit the UFO vs. population density data, but now color each point by the state’s Sasquatch sightings:
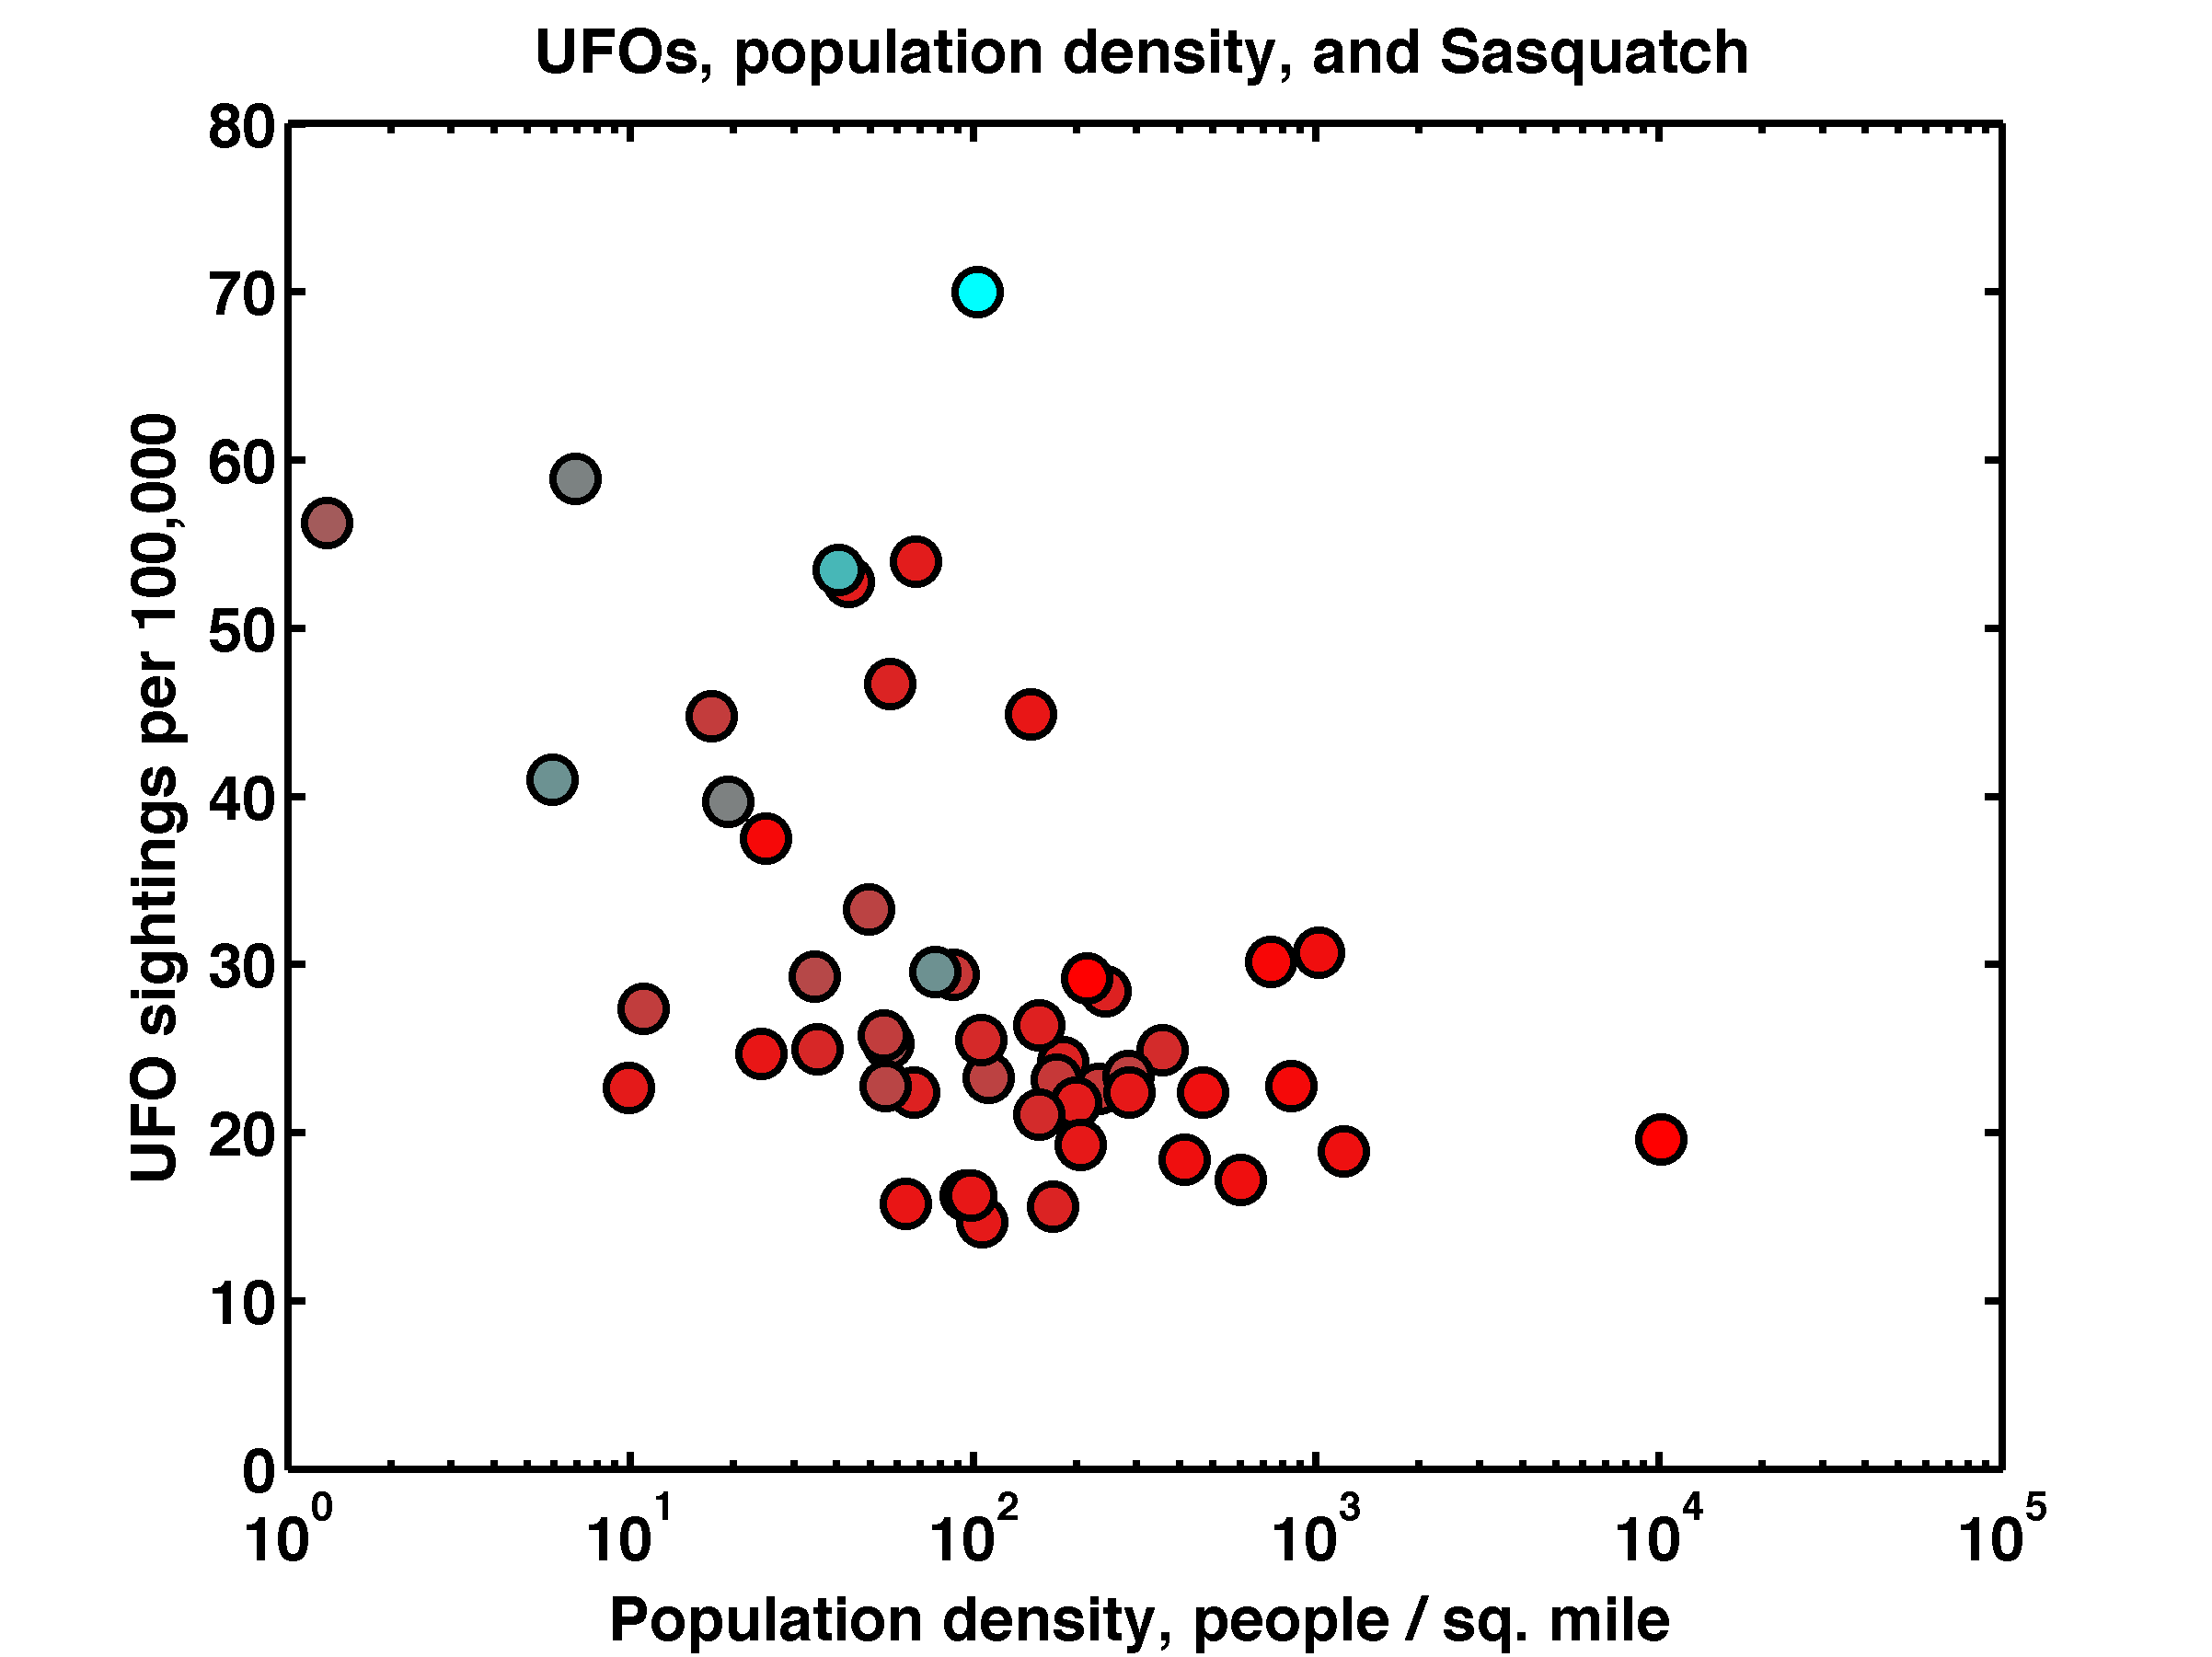
Here, red to cyan is 0 to 9 per 100,000 people. (Yes, I should have a colorbar.) Since the Sasquatch scale is rather bottom-heavy, it’s nicer if I map the square root of the Sasquatch count onto the red-cyan color scale (X = Oregon):

Happy World UFO Day!
P.S.
[1] If anyone wants my simple but unimpressive MATLAB function that colors points in a 2D scatter plot by the values of a third array, here it is. It would be fairly simple to add a colorbar, better hue or value sweeps, etc. Alternatively, you could pre-calculate colors and call MATLAB’s “scatter” function.
[2] If anyone wants an Excel file with all the UFO, population, and Sasquatch data, it’s here.
[3] The truth is out there!

Good stuff! But the best correlation would be to cell phone coverage, I think, since overall sightings have fallen as carrying a cell phone has increased (the thought being that you no longer can just gesticulate wildly while saying ‘I saw a UFO’ if you have a camera on you). But areas outside of cell phone coverage can keep on “spotting” UFOs to their heart’s content.
Good point! (It reminds me of http://xkcd.com/1235/ ). I have another theory, though, that the manufacture of cell phones and cameras requires rare metals from UFOs, fine hairs from baby Sasquatches, and bodily fluids from Loch Ness Monsters, so that secretly, high tech companies hunt down the last of these rare, tragic creatures, explaining their increasing rarity.