
 There’s been an flurry of papers and essays in the past few years on scientific studies being wrong, arguing that the number of incorrect conclusions is disturbingly large, and symptomatic of poor practice, misplaced incentives, and other factors. Perhaps the most widely seen views on this theme graced the cover of The Economist a few weeks ago; the article (in general quite good) is here:
 My & a colleague’s lab group meetings this term have involved reading and discussion of an excellent book on signal processing and statistics, and we decided to have our last session of the term focus on this peripherally related topic of everything being wrong. We read a few articles, one of which is perhaps my favorite in this area, a remarkably entertaining (but serious) paper on the misuse of statistics called False-Positive Psychology : Undisclosed Flexibility in Data Collection and Analysis Allows Presenting Anything as Significant [http://people.psych.cornell.edu/~jec7/pcd%20pubs/simmonsetal11.pdf]. It includes the great sentences:
…to help illustrate the problem, we conducted two experiments designed to demonstrate something false: that certain songs can change listeners’ age. Everything reported here actually happened.
Central to its points is the concept of a p-value, ubiquitous these days, which quantifies the likelihood that two sets of measurements are drawn from the same underlying distribution. For example: if I measure the height of a dozen kids, I might find that it’s on average 1.5 meters with a standard deviation of 0.3 meters. Suppose I give a second bunch of kids magic height-enhancing beans to eat, and measure their height as being 1.6 meters with a standard deviation of 0.4 meters. It is likely that I would have found the second group’s numbers even if the beans have no effect. They’re not much different than the first group’s. The p-value quantifies this, and would likely be large. By convention, a p value of 0.05 or less (i.e. a 1/20 chance of a difference as large or larger than the observed difference resulting from identical underlying distributions) is considered “statistically significant” (an awful and misleading term).
There are lots of ways p-values lead people astray; see this excellent comic for a simple one: http://xkcd.com/882/
The paper by Simmons & colleagues illustrates a less obvious way: Suppose, in the example above, I find a p-value of 0.2 (i.e. 20%.). I think: this isn’t far from 0.05, so maybe my magic beans are having an effect. Being a good scientist, I’ll increase my sample size — the number of kids– and see what happens. I keep adding kids to the bean-eating group, and keep calculating p. Voila! At some point I find p < 0.05, and announce that my magic beans have an effect. Fame and fortune await!
What is wrong with this? The p-value is itself stochastic; its value fluctuates as the data fluctuates. Even if it’s average converges to the “true” value eventually, by chance it can meander high or low. With freedom to decide when the experiment ends, one biases the outcome. (It’s a bit like adding more M&M colors in the cartoon I linked to above.)
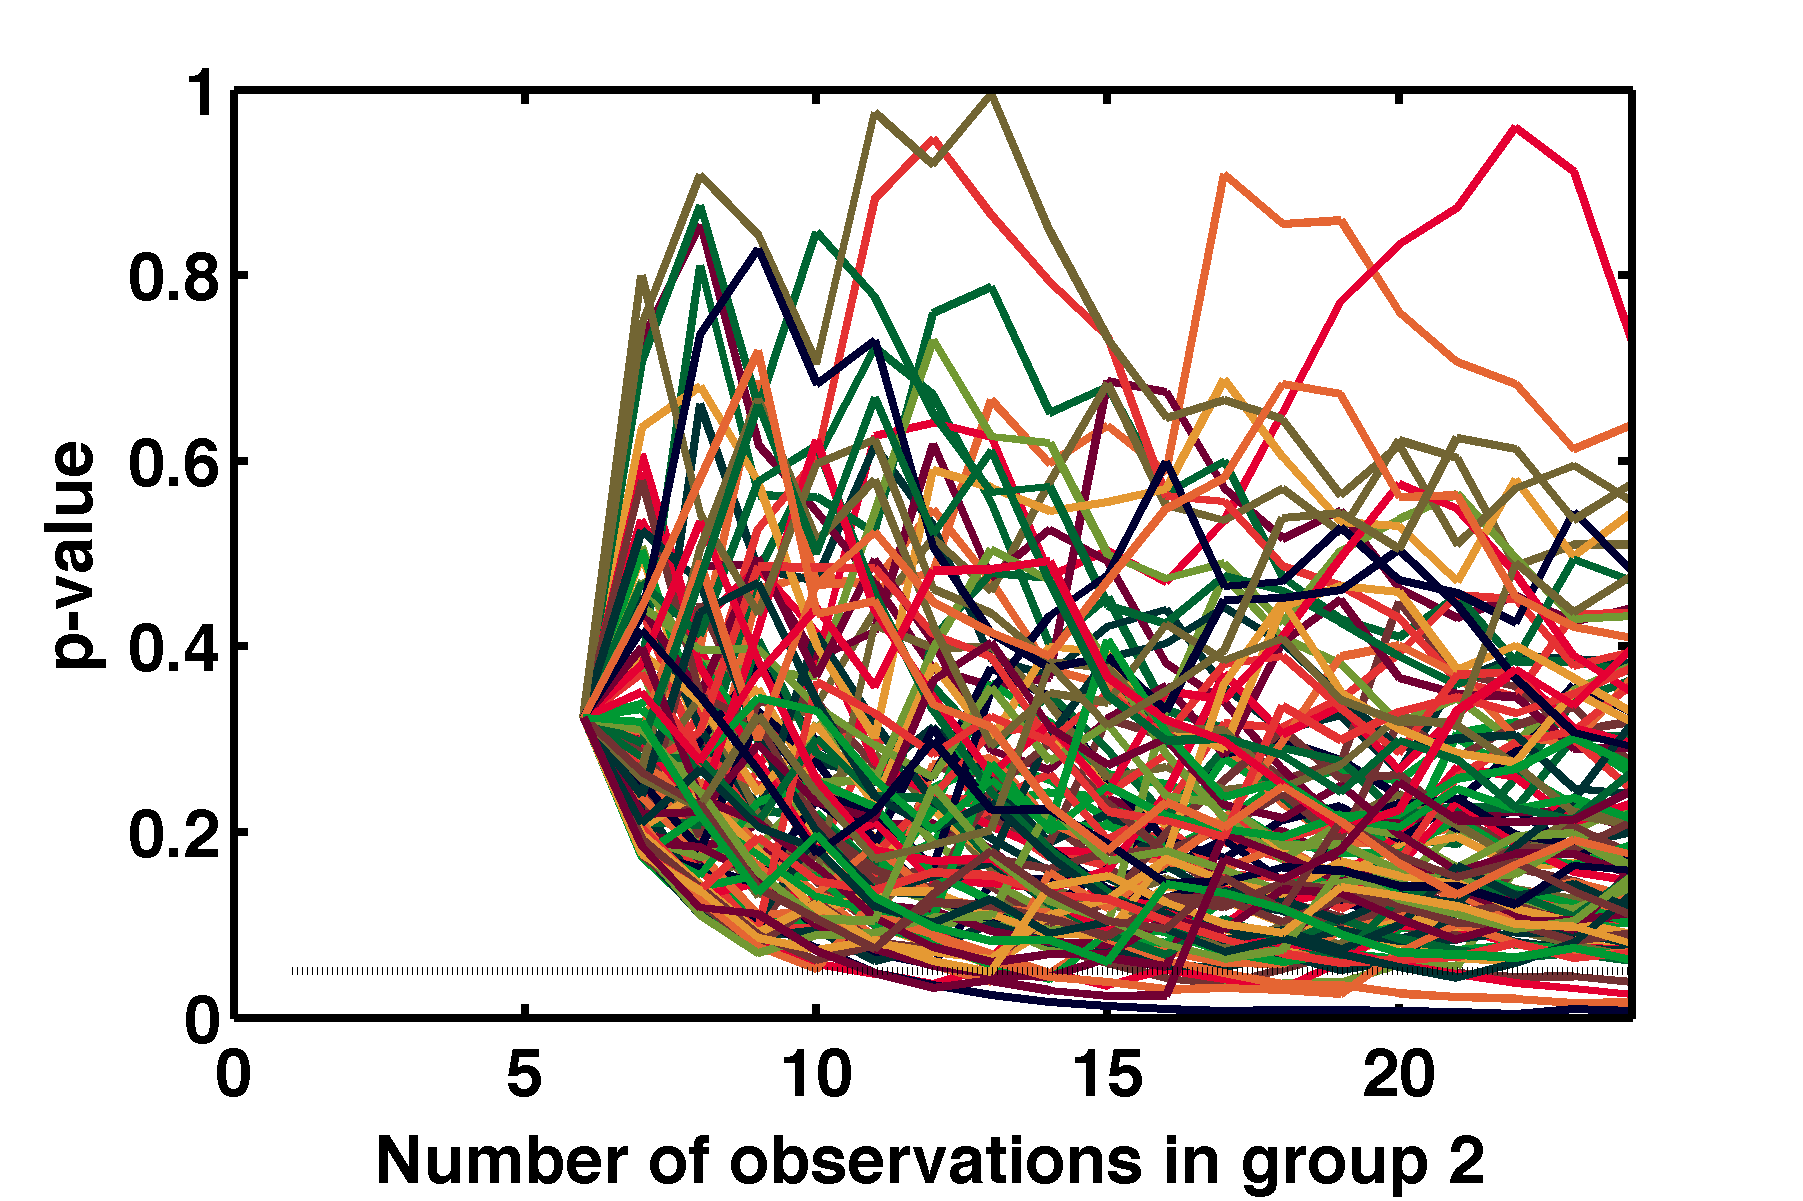
Seeing this in the math of statistical tests is challenging. However, following the theme of my last post, these sorts of statistics are very easy to simulate! In the graph at the top of the post, for example, I’ve shown what happens to p-values from the comparison of two groups drawn from identical distributions, as the number in the second group increases. (Each group is drawn from a Gaussian distribution with mean 12 and standard deviation 1; there are six objects in the first group.) The 100 lines each indicate a different instance of this “experiment.”
Sometimes p goes up, sometimes it goes down, sometimes it crosses 0.05. With fairly minimal proficiency in a language like MATLAB (which has built-in toolkits for statistical tests), it takes just a few minutes to whip up a simulation of statistics that gives one an intuitive feel for experimentally-relevant analysis decisions, and that can perhaps save one from appearing on the front page of The Economist. I don’t think it at all unreasonable to expect every science major undergraduate to be able to do this (and to train them to do this). It would transform the landscape of science!

The cartoon is terrific, and your comments spot-on.
When I was a grad student (in stats), one of the tasks we did was to run a sort of consulting shop for the other disciplines. We provided free drop-in advice for researchers or students with questions, and most often, had med school, psychology, or B-school students come by. My recollection at the time was, “uh-oh. As the folks at SAS include more canned routines and make it easier to use, there is going to be trouble.”
The “XKCD” example you cite, we used to try to impress upon (more often than not), the psychology department folks, using a variation of the famous “drunkard’s walk.” We modified it slightly by making the bar the only absorbing state. Thus, the person will *always* wind up at the bar.
Beyond the obvious problem of multiple testing and variable stopping rules, one massive problem I encounter is the focus on p-value and the disappearance of its evil twin, statistical power. Even if one pre-specifies a sample size and thus reduces the possibility of an experiment ending once a result of p<0.05 (or, 0.01, or whatever level is chosen), the reality is that one can easily reject the null with a large enough sample.
In the case of Phase 3 trials, if a molecule has reached that level, the chances that it has absolutely no impact is pretty small. Therefore, with a massive enough sample, you will reject the null, and your beans will show quite 'effective' in this case. The "fix" that has been attempted has been to pre-specify minimal clinical difference. I think anyone who reads your blog will be able to see the inherent problems.
I've found (and been heartened) by the increasing acceptance of Bayesian methods in health research. The battle is not easy, but I have some confidence that it will eventually bring more order here.
Whether that confidence is 95%, I can't say with any real power.
Thanks! The stats “consulting shop” sounds like a fascinating experience. When I was an undergrad at Berkeley in the mid-1990s I remember seeing flyers for some similar service, and not knowing anything at all about the subtleties of statistics then (being a physics major), the flyers seemed completely mysterious to me.
Coincidentally to your note on Bayesian methods, a recent post on Andrew Gelman’s really blog (http://andrewgelman.com/) points to slides on a talk: “Can we use Bayesian methods to resolve the current crisis of unreplicable research?” Gelman’s blog is consistently fascinating — one of the best out there.