A friend pointed me to a recent study looking at the earnings (salaries) of people with degrees in different majors — for example, what’s the average salary of a physics major? Or a history major? The authors of the study are economists, and in my opinion put forth in their exposition of the study an overly pecuniary view of the factors that go into choosing a major. Regardless of their utility, though, the data are interesting. The web site is here, and includes link to a summary and a 214 page full report. In case you’re curious, the median salary of 25-59 year-olds with undergraduate degrees in physics is $81,000, making it rank #15 out of the 137 majors listed. I’m surprised this is so high. Nine of the top ten majors are various flavors of engineering, with the other (#2) being pharmacy. Chemistry is #50 ($64k) and Biology is #74 ($56k). Depressingly, at the bottom of the list is Early Childhood Education ($39k) — something of immense importance, but that doesn’t pay well.
In addition to salary, the report looks at the popularity of various majors. I was curious whether these two are correlated — whether, for example, there’s a “supply curve” (thinking like an economist) such that the majors for which students are abundant are those for which the pay is less. (This would assume that a lot of other factors are equal across majors.) I can’t extract the number of people with each major from the report — at least not unless I put a lot of work into this, which won’t happen. However, I can easily extract the rankings for each (salary and popularity) and can plot these:
 (The colors indicate categories, detailed in the legend of the next graph.)
As you can see, it’s a cloud! There are popular, lucrative majors, unpopular, low-paying majors, and every other combination.
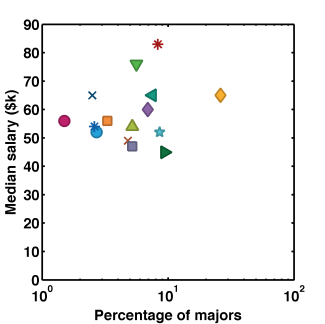
The 137 majors in the study are grouped into categories. If we plot the median salary (the actual amount, not the ranking) versus popularity (percentage of majors), we get the following:
 Again, there’s no trend evident. Stretching the horizontal axis with a semilogarithmic scale gives us a nice triangle of points (with one outlier):
 Is there a lesson here, other than that there are a lot of business majors? I don’t know. I’ll leave that to you, dear reader.

Something smells wrong about the $81k figure. I wonder if this survey is systematically biased on all majors. If so, then its greatest utility is probably in comparing majors, not predicting incomes for a given major.
Thinking a bit more: perhaps the $81k number is not so unreasonable. The median starting salary for a physics major is apparently ~$50k (http://physics.illinois.edu/undergrad/post-details.asp?1343). The $81k number from this study is the median salary for ages 24-59 or so (a span of 36 years). At 3% annual real GDP growth, the median of $50 k over 1-to-36 years is $84k — not too far from 81. (If the starting salary were $40k, the median of the compounded salaries would be $67k.)
Of course, I don’t know how reliable the $50k number is!
Brain fart. I read it as “25-29 year-olds”, thinking this was early career median salary.
For 25-29 I agree that it makes more sense.
Argh! I meant 24-59.
I agree that it’s strange. I haven’t looked at the source material (U.S. Census Bureau, American Community Survey, http://www2.census.gov/) — it’s not immediately obvious how to parse this.
Thanks for this insight Raghu. These plots will be very useful when I speak with prospective physics majors.
Boy, it is very depressing to see all of those ‘education’ triangles at the top of that plot though. That does not bode well for the future in my humble opinion.