As of yesterday, the graduate student union here at the University of Oregon is on strike*. (I walked past three separate picket lines on my way to get coffee.) I don’t have anything profound to write about labor issues, but I thought I should post something that’s graduate-student-related!
Quite often, the topic of “time to degree” in Ph.D. programs comes up, i.e. the number of years it takes to successfully complete a doctoral program. No one expects this to be short — getting a Ph.D. isn’t easy — but there’s often concern that it’s too long, or perhaps is longer than it used to be. Recent data on this are easy to find, but I’ve never seen a graph that goes farther back in time than a decade or two**. So I poked around a bit, and constructed the following graph from various NSF reports, mostly summarizing the annual “Survey of Earned Doctorates:”
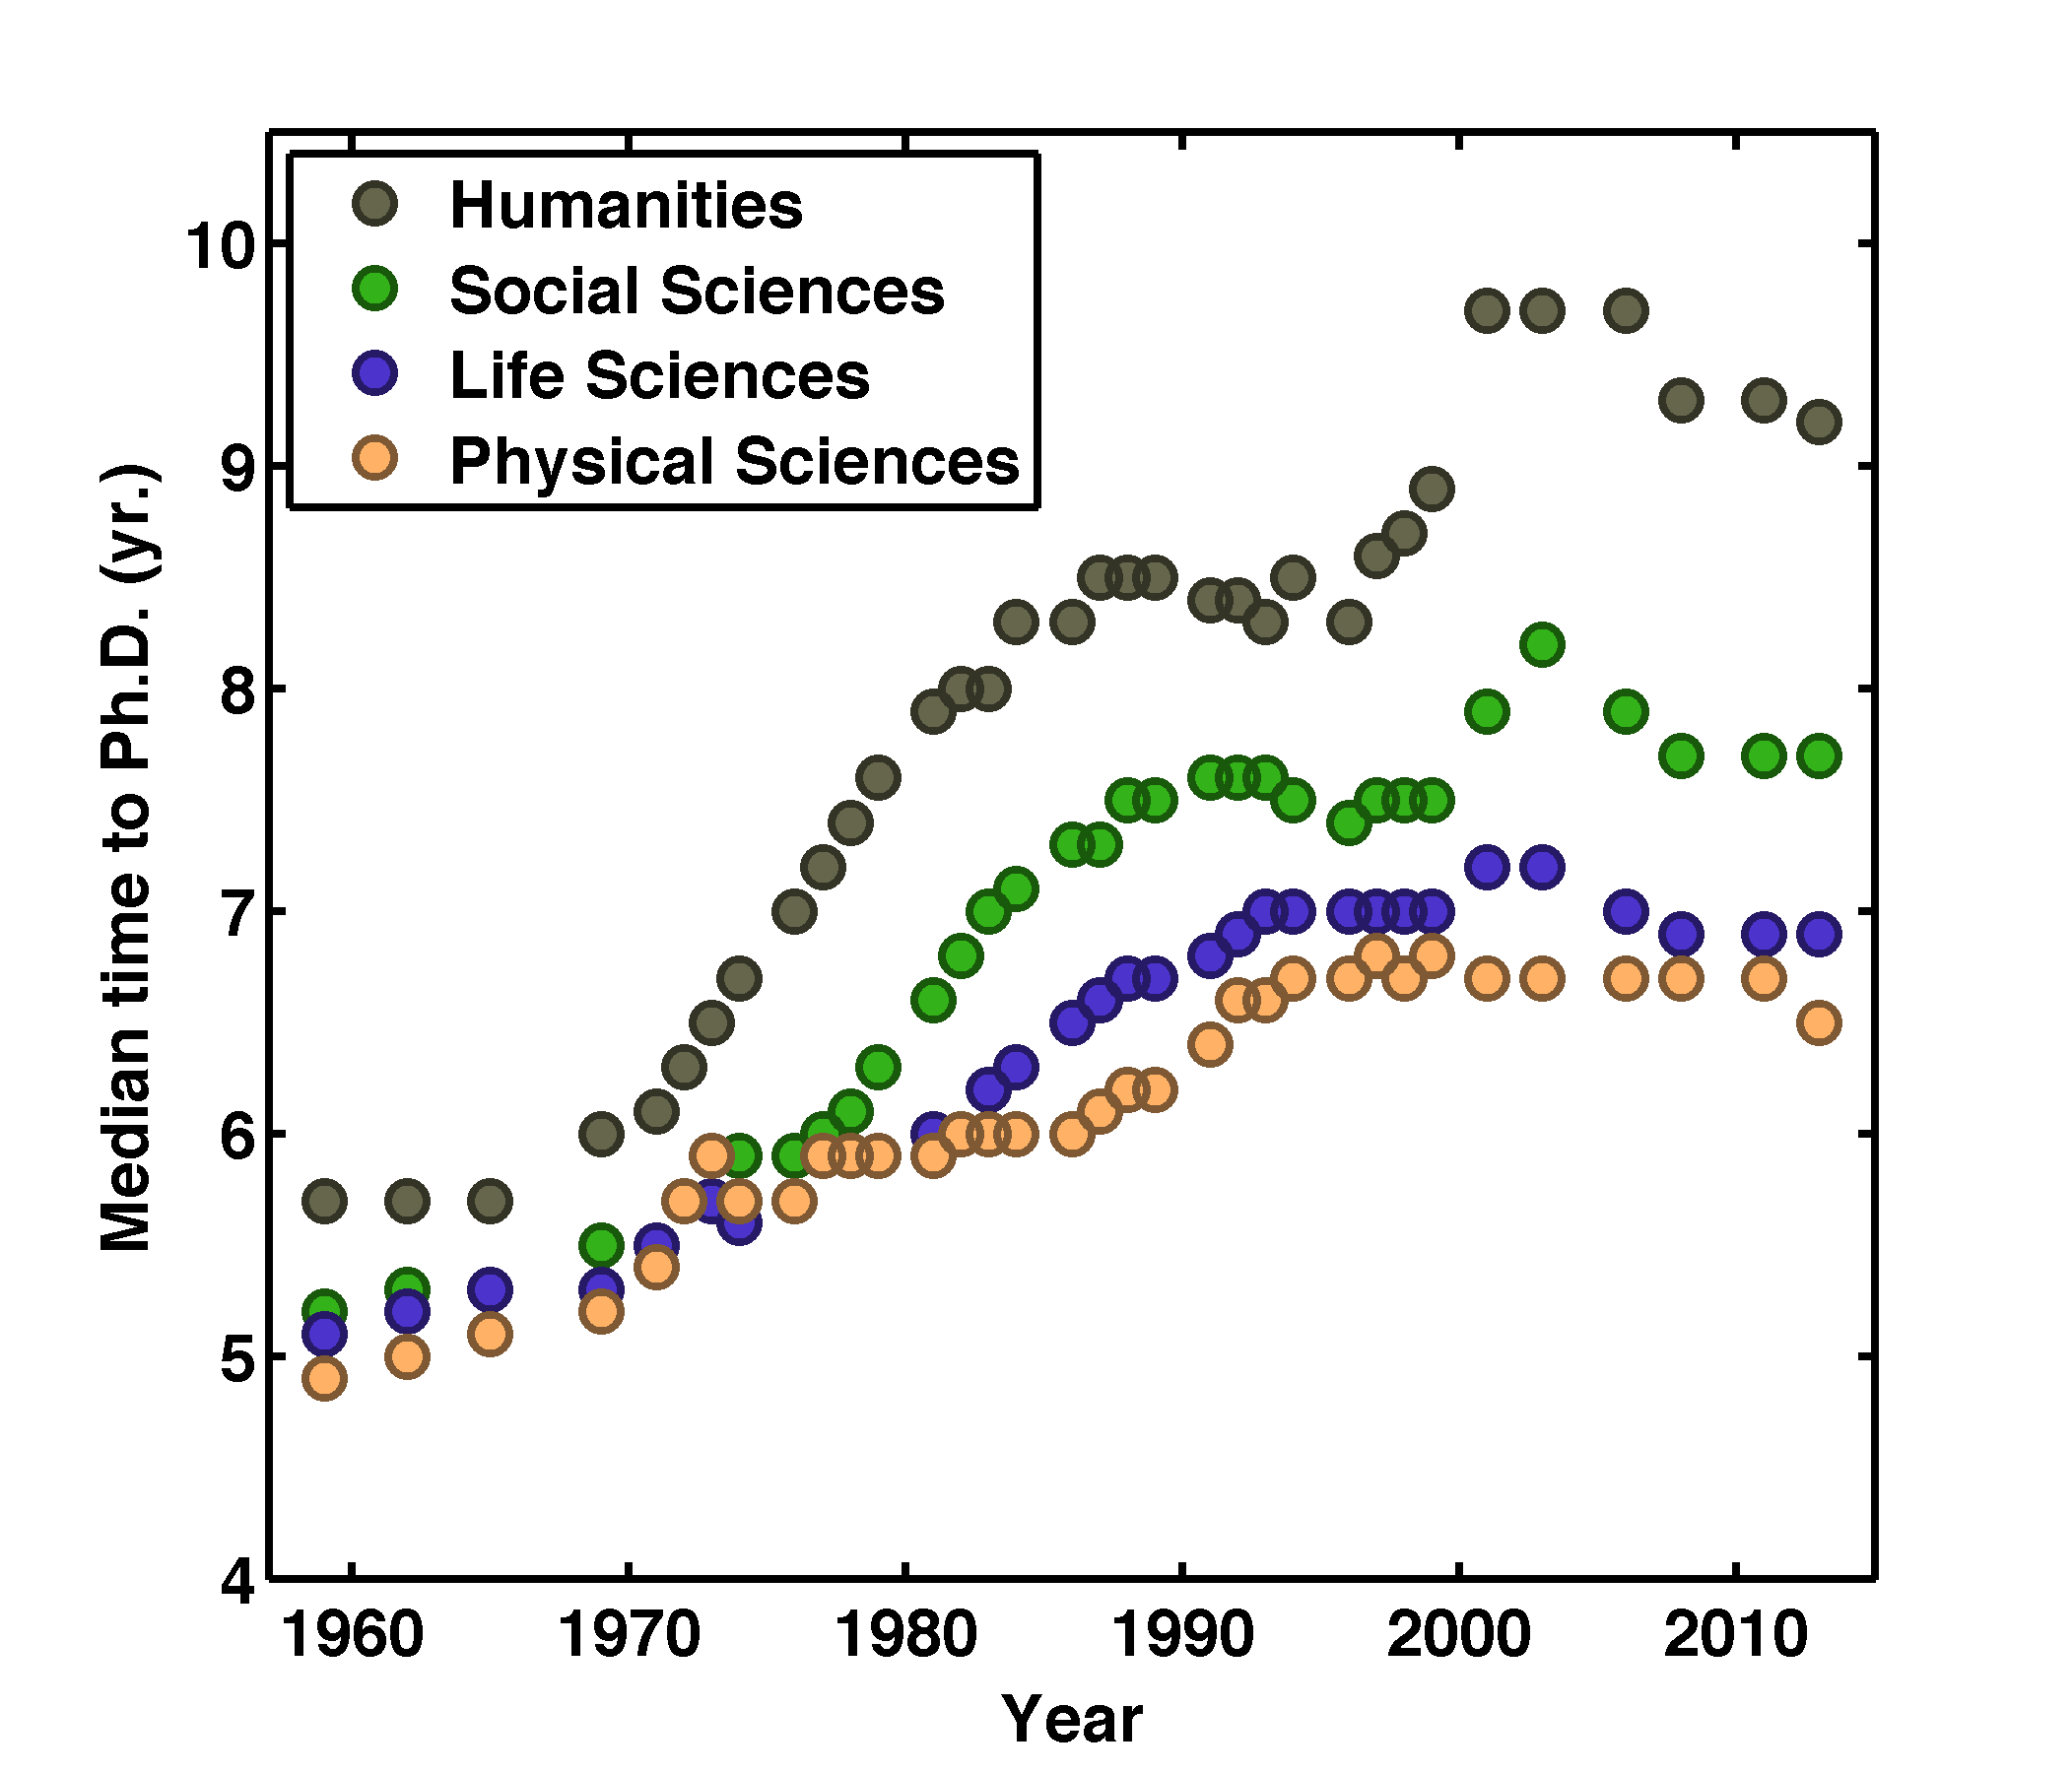
You can download my file tabulating all the data here [Time_To_Degree_Statistics]. (I’ve omitted one set, from a 2012 report, that contradicts other data; this is indicated in the file.)
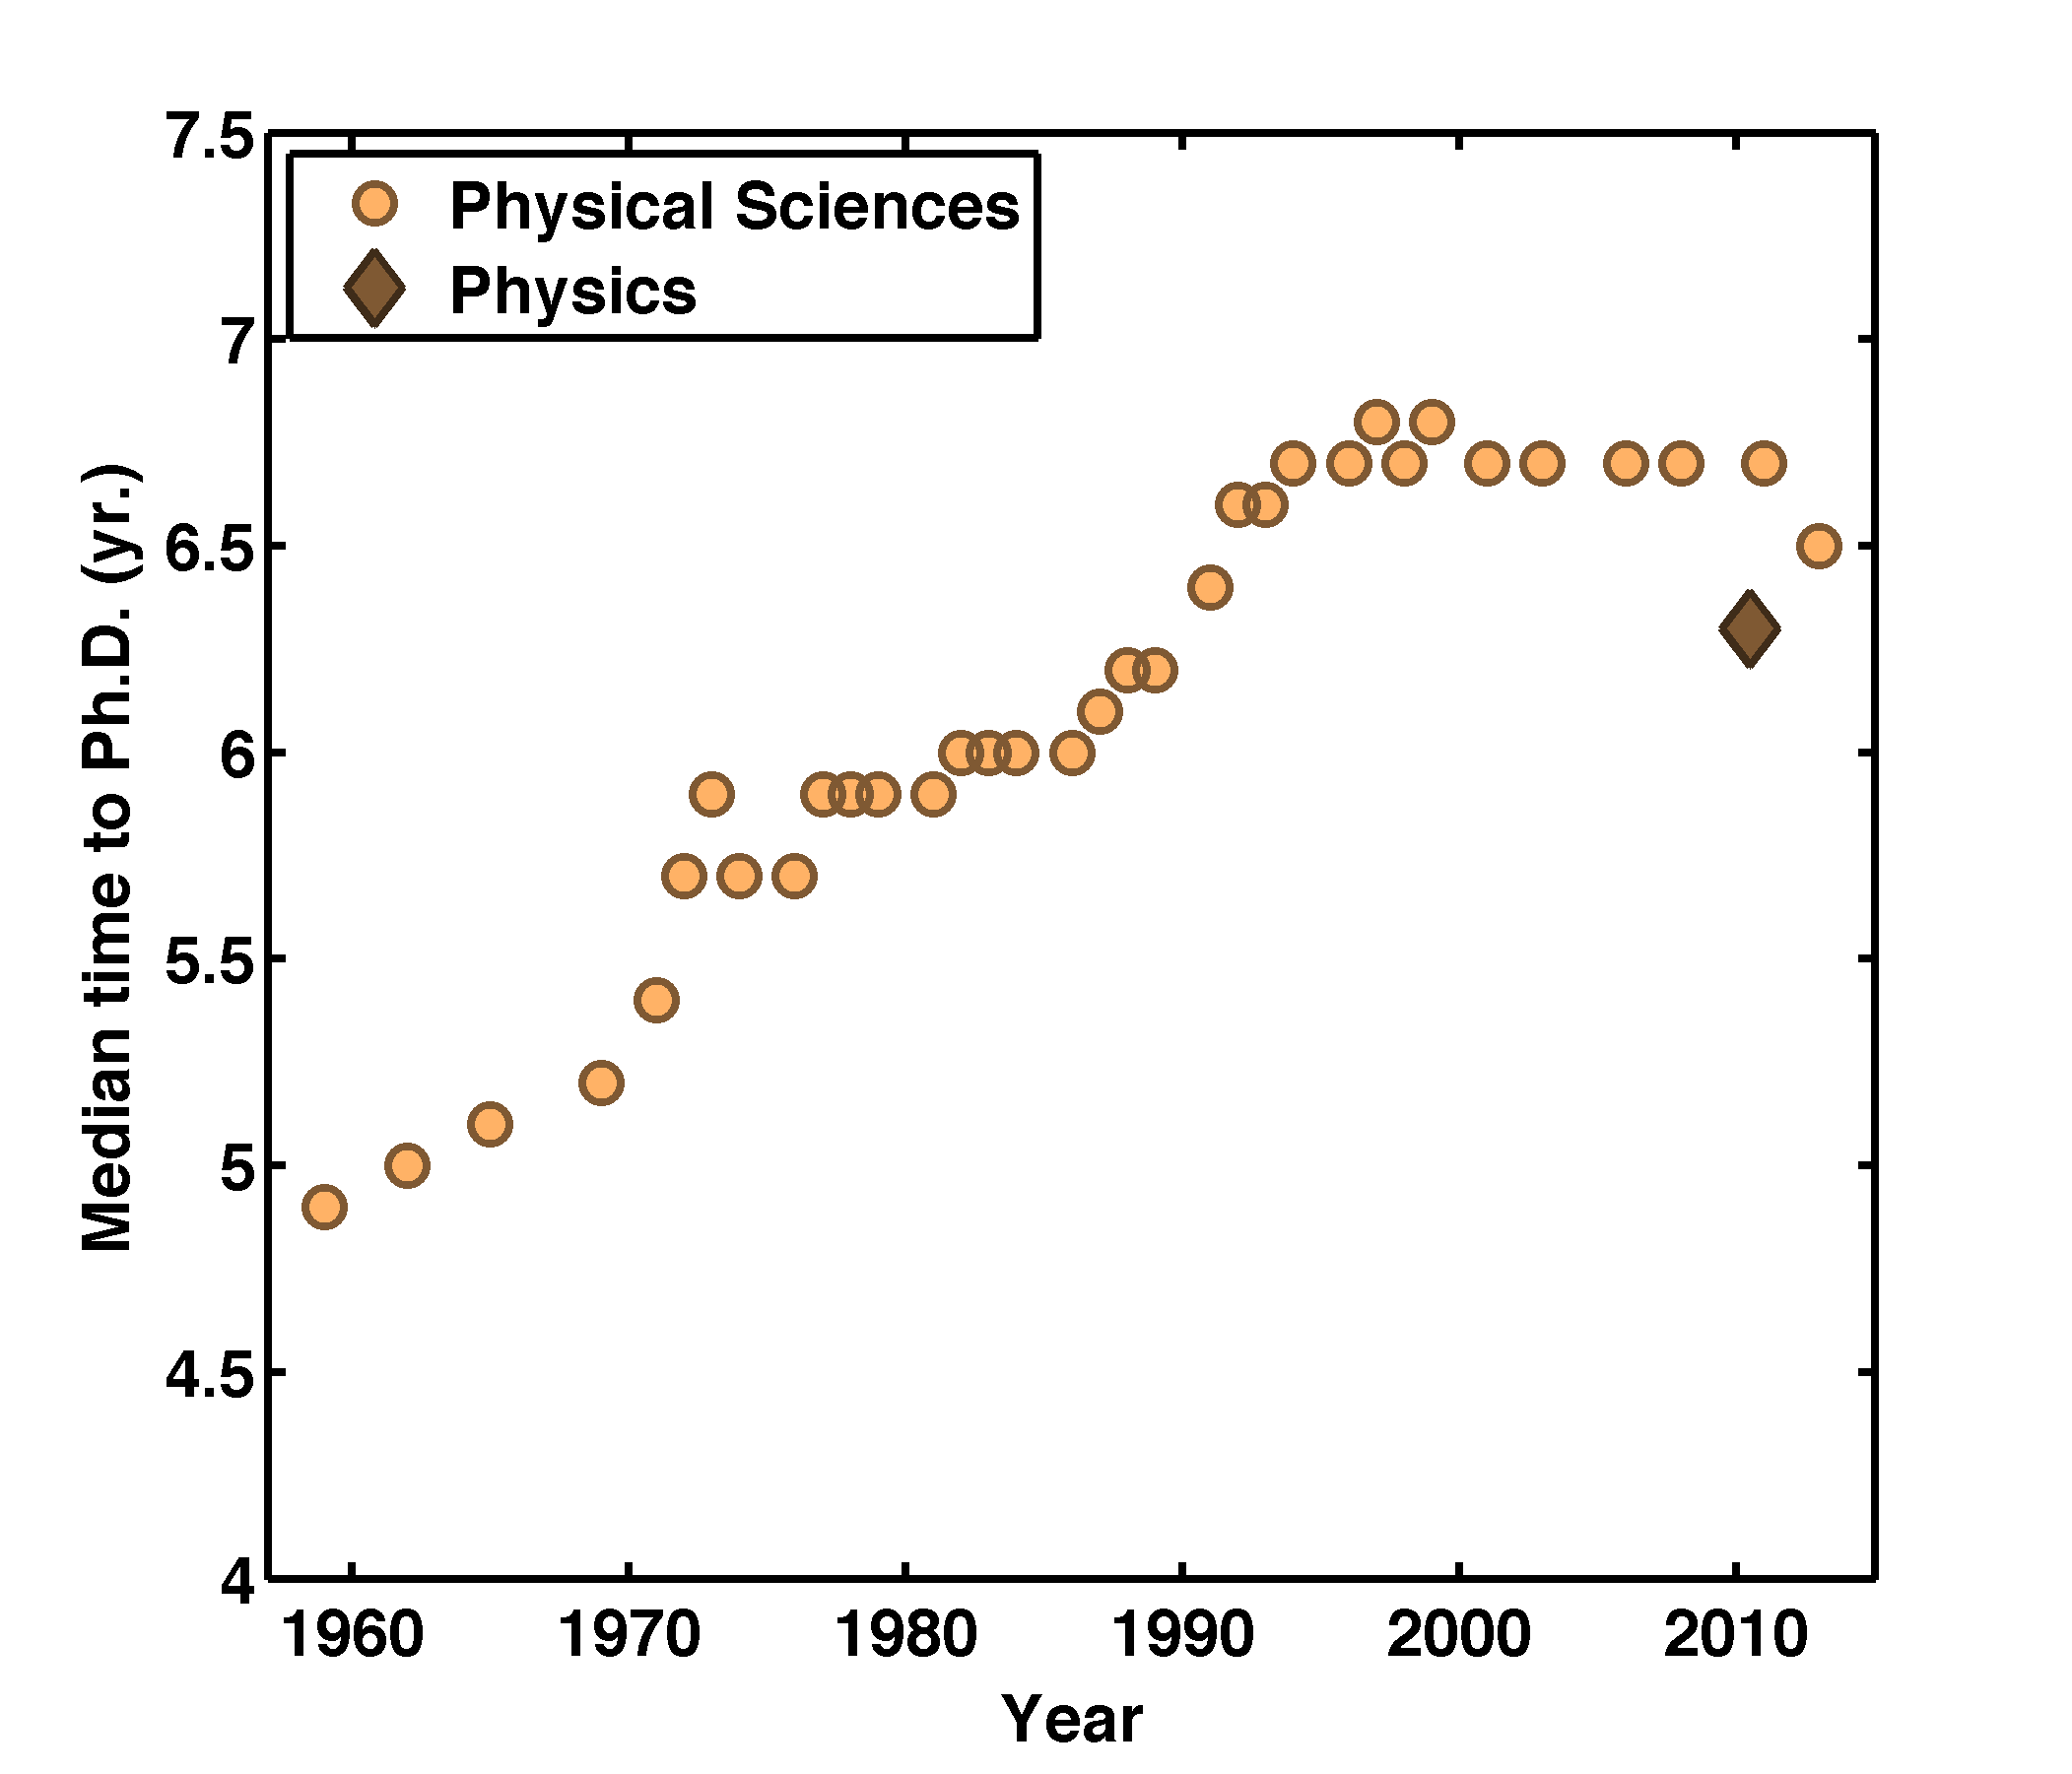
I’ll also plot just the physical sciences, adding a data point just for Physics Ph.D.s in 2010 & 2011: 6.3 years ***:
There are several striking things about these plots. One is that all of them show a similar form, namely a strong increase over time from the 1960s until 1990-2000 followed a stabilization, despite presumably large differences among the fields of study. Can we highlight this “universality?” As with other systems, we can look for some sort of scaling that will collapse all the curves onto one another.
Let’s denote the time-to-degree by D and time by t, and note that all the fields start with a value around D_0 = 5 years in 1960. Is there a scale factor m_i for each field of study, i, that will collapse all the D(t) curves onto one “universal” function, f(t)? I.e.
![]() I searched through the space of m_i for the set that minimizes the total variance of m_i [D_i(t)-D_0] (i.e. the scatter of the various re-scaled curves). Plotting the rescaled time to degree gives:
I searched through the space of m_i for the set that minimizes the total variance of m_i [D_i(t)-D_0] (i.e. the scatter of the various re-scaled curves). Plotting the rescaled time to degree gives:
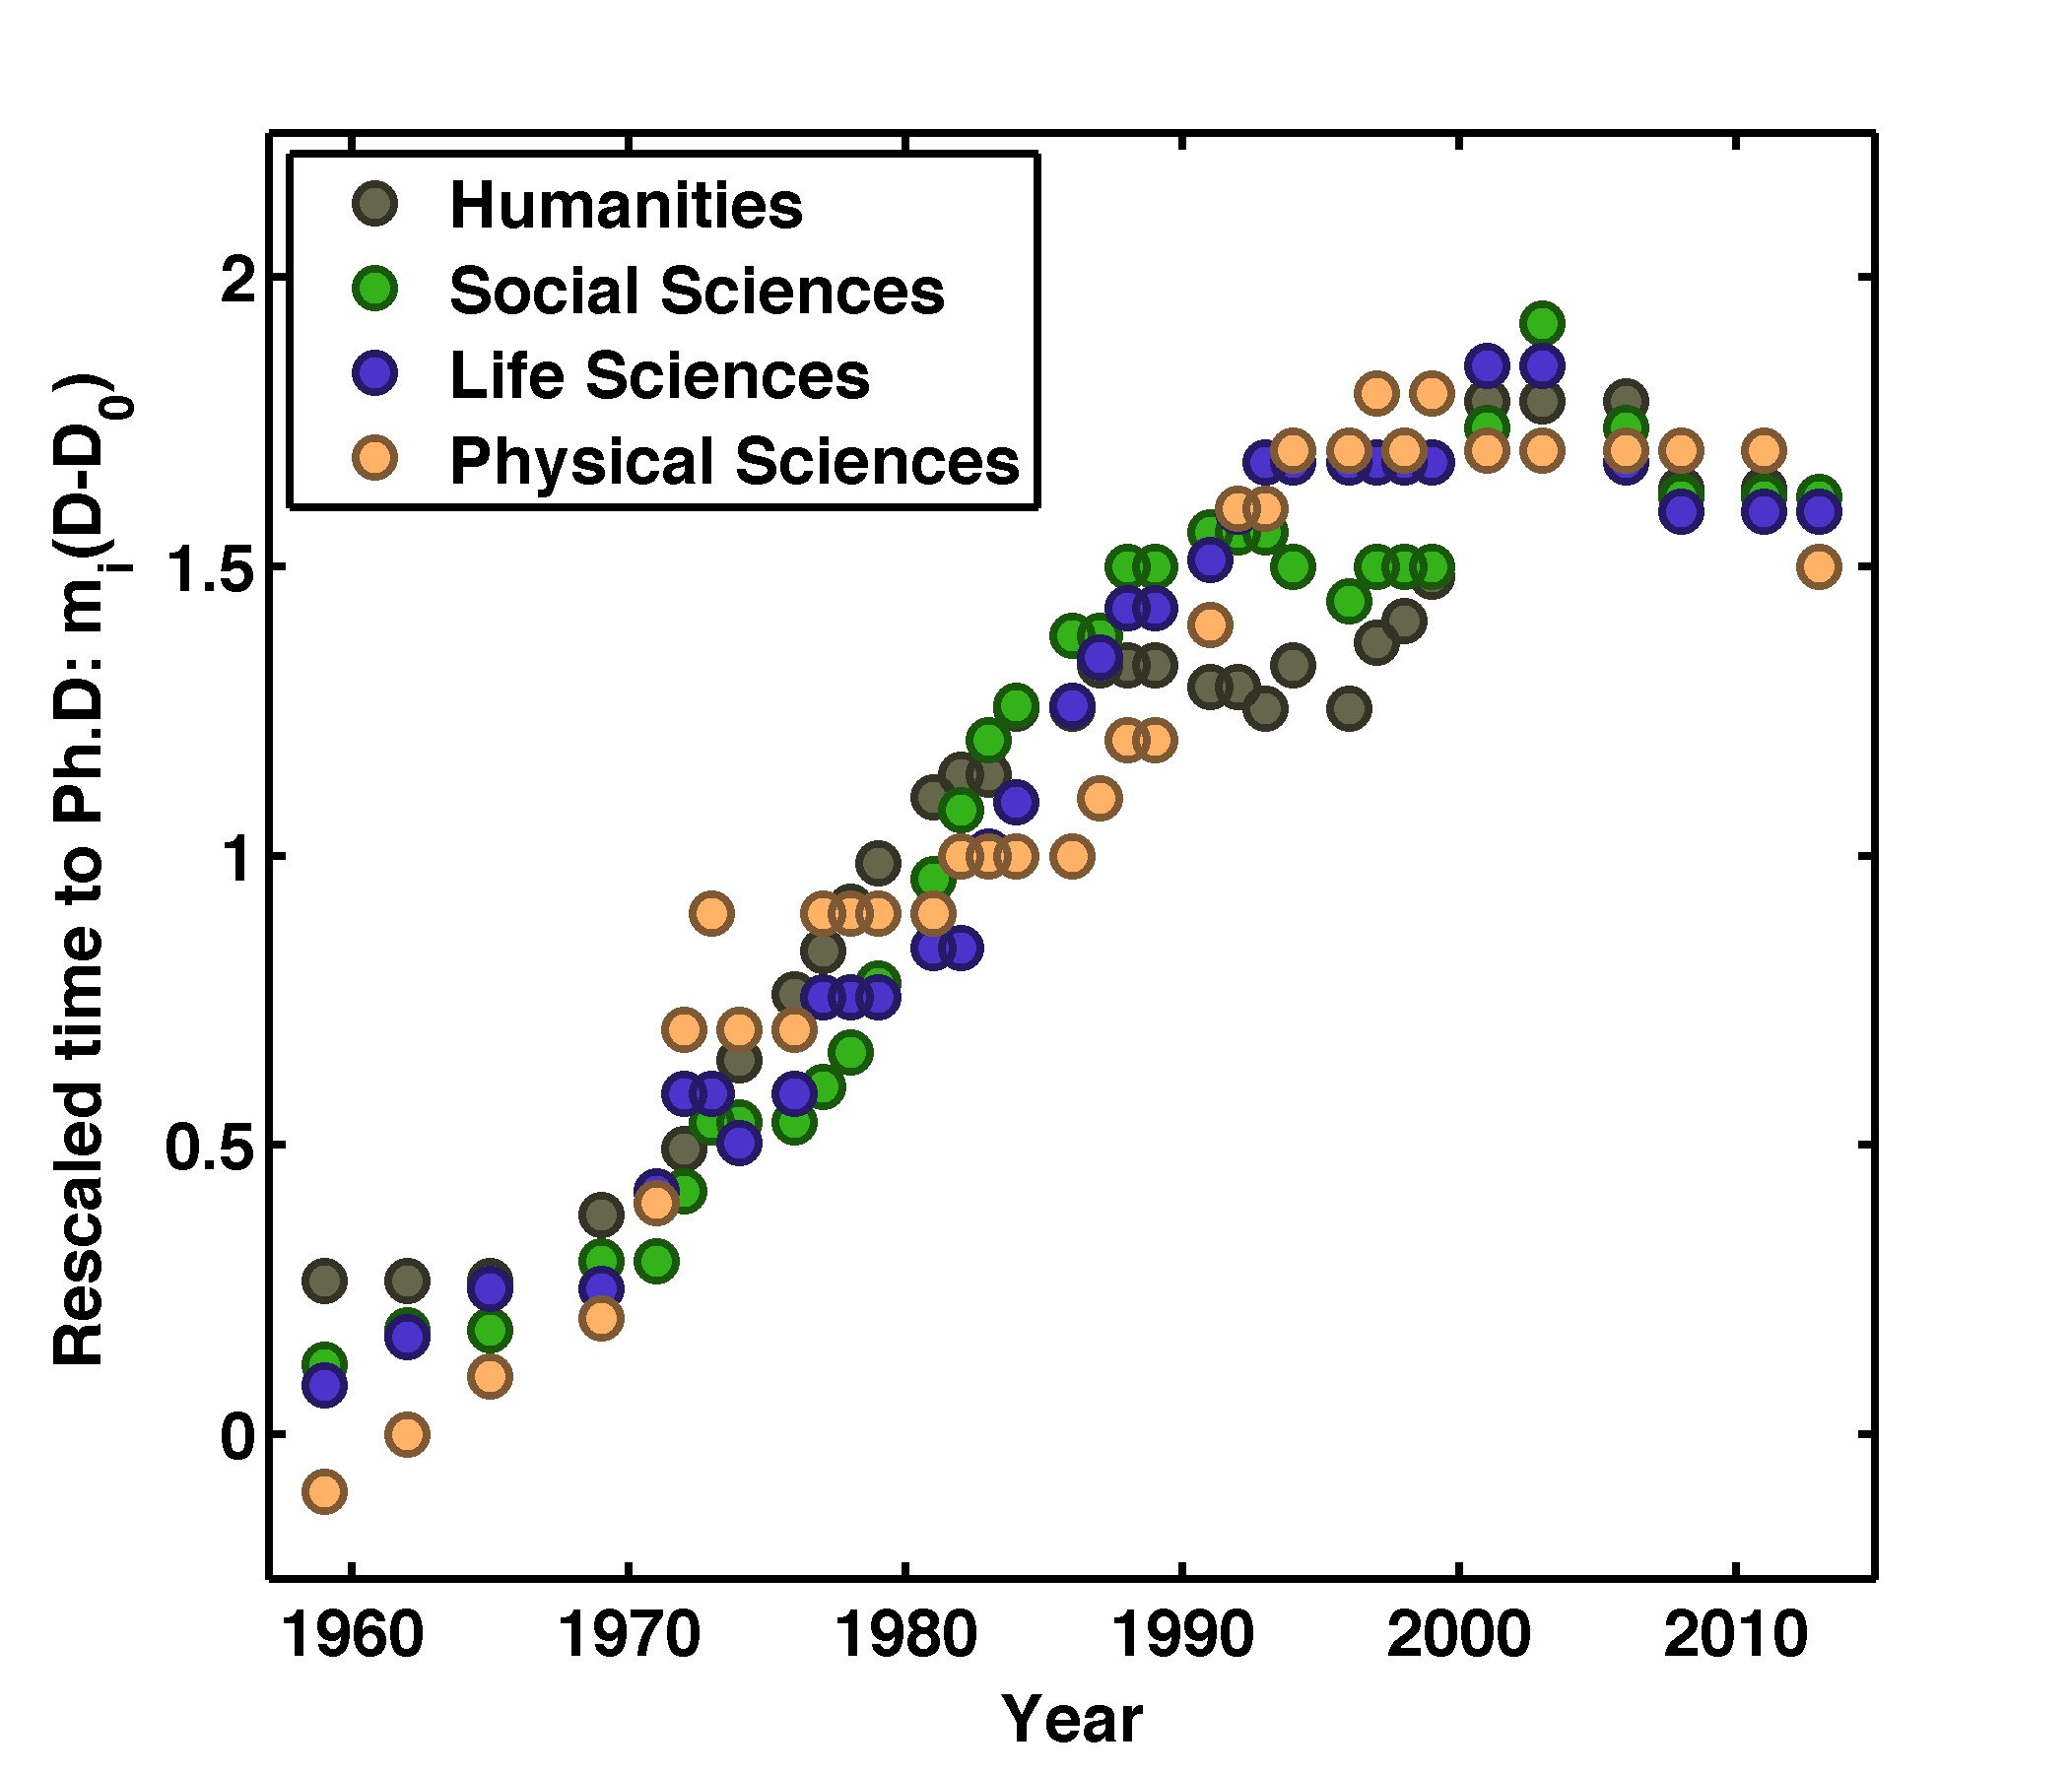
All the different field’s data collapse surprisingly well onto a single curve! (If you’re curious, the scale factors, setting the physical sciences’ m_i to 1, are 0.84, 0.60, 0.38 for life sciences, social sciences, and the humanities, respectively.) In other words, these fields differ in the magnitude of their increases in time-to-degree, but have nearly identical forms. Why should this be? Why should the way the duration of graduate school changes in physics mirror at all the way it changes in art history?
I’m sure people have thought about this question, and there’s probably a lot written about it that I’m unaware of. I’ll just note here that another striking thing about all these plots is that something magical happened around 1990-2000. Before this, time-to-degree was steadily increasing. Then, we find a plateau, and time-to-degree has been quite stable for the past two decades. Again, the fact that this is manifested across fields suggests, I think, that there’s not some particular maximum number of years that students, or advisors, prefer, but rather that around the mid-1990s the significant increase in time-to-degree became widely appreciated. Focusing their attention on it, people across fields, by whatever means, inhibited further rises and left us where we are today. If this is true, we could just as easily “set” the level at some other point, longer or shorter. An alternative explanation is that the “natural” f(t) really does have a plateau, suggesting some hidden psychological and economic dynamics that give us, unavoidably, the exact state we’re presently in. I find this hard to imagine, but I can’t claim to understand psychology or economics!
Today’s picture at the top of the page: a great blue heron I quickly painted a few days ago. S’s is below, at the end.
* For non-local readers: you can learn a bit about this at https://www.insidehighered.com/news/2014/12/03/u-oregon-grad-students-strike-better-benefits, http://provost.uoregon.edu/gtff-negotiation, http://gtff3544.net/answer-to-fund/ It’s interesting.
** There’s a graph I found at at http://mlaresearch.commons.mla.org/2014/05/14/opportunity-costs-of-the-phd-the-problem-of-time-to-degree/, supposedly from the same NSF data; it disagrees in a few places with the values I’ve gathered and plotted above.
*** “Trends in Physics PhDs,” Patrick J. Mulvey and Starr Nicholson, Feb. 2014, http://aip.org/sites/default/files/statistics/graduate/trendsphds-p-12.2.pdf