
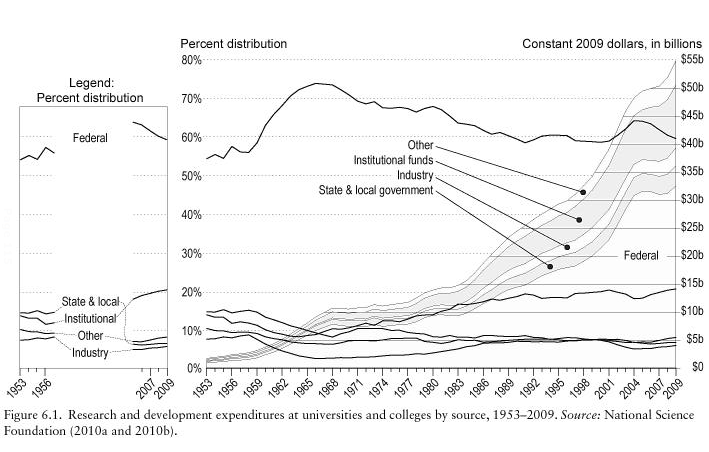
There was some conversation in the department today about science funding trends, the discouragingly low success rates for grants, etc. Just to have a place to point to, I’ll post some graphs, with almost no commentary. Here’s science funding over the past few decades, in constant dollars, from Paula Stephan’s excellent How Economics Shapes Science (about which I should write more later):
Of course, GDP has risen sharply in this period also (from Visualizing Economics):

From which we’d want to know what funding levels as a fraction of GDP have historically been. From AAAS:
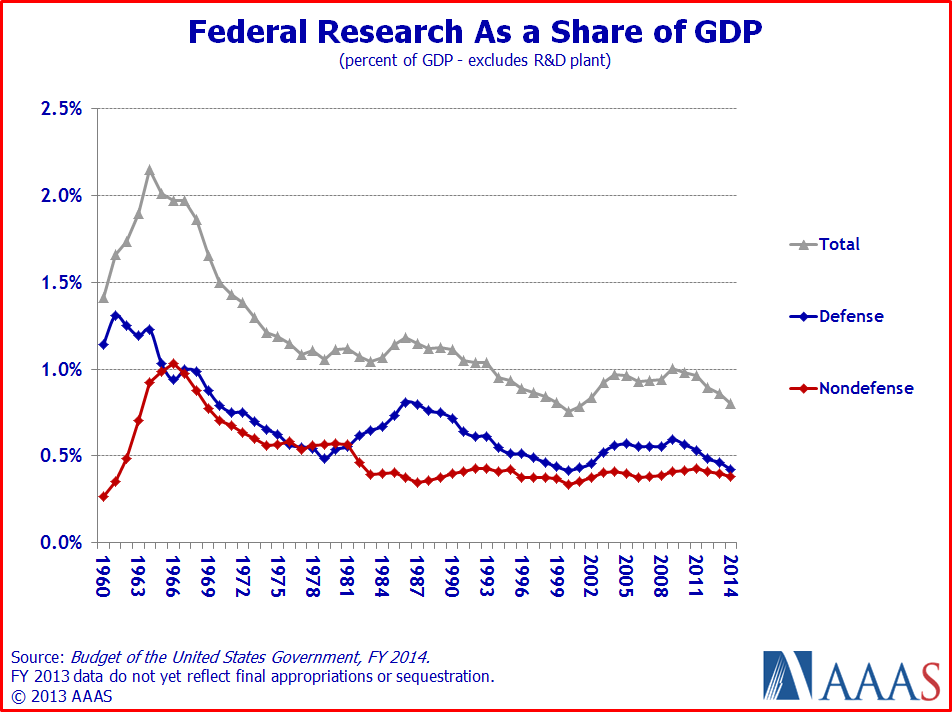
So: After the good ol’ days of the sixties and seventies, we’ve steadily been at 0.3-0.4% of GDP. However, these graphs don’t illustrate the distribution of funding within the sciences, the growth in the number of scientists, and the steadily increasing cost of science. (For example: even over the past 7 years that I’ve been at Oregon, the cost to a grant of a graduate student has grown faster than inflation, due, among other things, to increasing tuition costs.) Hence the ~15% funding success rates that many of us experience, as well as other stresses.
I should stop writing this, and get back to the two grant proposals I’m presently working on…

Can we really complain about the level of science funding when the budget cuts are affecting people in real need? People like the Syrians, who are in real need of a good old American missile pounding that some people think we can’t afford!
But really… ugh.
See also this graphic: http://nihdirectorsblog.files.wordpress.com/2013/09/sequestration-global-rd-funding-change.jpg. (Things are bad here in Canada, but worse south of the border…)