
This coming Monday I’ll give a presentation to parents of incoming freshmen, part of the university’s new student orientation program. I’ve done this before, even though I’m a bit unclear on what the goal of the event is. Nonetheless, I again agreed, largely because I think there’s generally a lack of dialogue between the public and academics about what the point of higher education should be, and even what the structure of higher education presently is. (And, it’s been fun in the past!)
The instructions note that, “Typically what presenters have done in the past is give a 25-30 minute mini lecture, demonstrating how they teach classes,” followed by a long question period. In the past, I’ve talked about one or more of the (several) courses for non-science-students that I teach, focusing on a few examples. (Perhaps more on this some other time.) I also talk about the structure of courses, “active learning,” and the general question of how to do well in classes — something the parents seem more interested in than their children are. This let’s me include one of my favorite “classroom experiment” graphs, from a midterm exam in which I, afterwards, divided the students into two categories and plotted the mean and standard deviation of each. Before scrolling down, see if you can guess what the categories are. (Note: it’s not class year, sex, or anything demographic.)
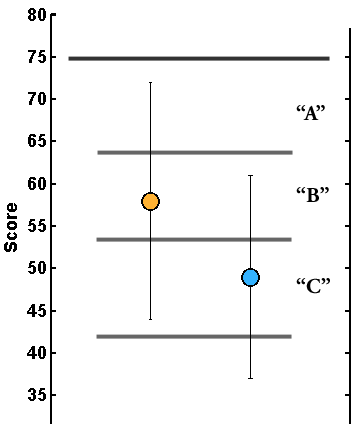
The answer: The left spot is from students who sit in the front half of the class; the right one is the back half. (N is about 120.) Of course, this doesn’t reveal which way the causation goes. Others have looked at this issue, though, including one Nobel Prize winner: Katherine K. Perkins and Carl E. Wieman, “The Surprising Impact of Seat Location on Student Performance,” The Physics Teacher (2005), vol. 43: 30. http://tpt.aapt.org/resource/1/phteah/v43/i1/p30_s1

One thought on “On classes”